
Will the River Mole Dry Up This Summer? Decoding Past River Vanishings and what Data is telling us for July-August 2025
- Jun 24, 2025
- 28 min read
Updated: Jun 28, 2025
Where Did the River Go? Understanding the Vanishing River Mole
Every so often—perhaps once in a generation—the River Mole performs a remarkable vanishing act, silently vanishing underground through the chalk swallow holes of the Mole Gap. In the driest and hottest years, long stretches of the riverbed fall dry, before the water mysteriously resurfaces kilometres downstream.

This post explores the puzzle of these "Vanishing" events, drawing on decades of hydrological data to investigate what conditions cause the Mole to disappear—and what might be coming in 2025. From historic maps to recent groundwater analysis, I’ve pieced together a picture of how rainfall, aquifers, geology and climate interact to shape the river’s fate. This is very much a work in progress, a summary shaped by conversations and explorations with fellow River Mole River Watch friends and local river enthusiasts. I’m sharing it now to mark a moment in my muddy understanding rather than the last word on this phenomenon — indeed, as C.C Fagg so aptly put it...
“ After three seasons of close observation I am far from being able to say the last word on these fascinating phenomena” . C.C Fagg

During dry summers, the River Mole is famous for "vanishing," leaving a dry riverbed as it flows over the chalk of the North Downs through the Mole Gap, before reappearing downstream from springs at Leatherhead. The last time this happened was in 2022.

This intriguing phenomenon has been explored by locals, cartographers, and authors, most recently by Peter Brown in his great book, "The Vanishing River of Box Hill" (2019). Various factors such as low rainfall, low groundwater, and reduced river flow have been suggested as causing the "River That Runneth Under."


Historic vanishings of the River Mole: clockwise from top left Ham Bank 1949, Norbury 1976, partial drying 2019 and latest drying 2022
In this post I'd like to investigate the Vanishing River Mole phenomenon further by using data on the weather and river conditions that led up to past disappearances and compare this with selected "normal" years and "near misses" where conditions seemed primed but no vanishing occurred. Finally we will assess what the data indicates for the rest of Summer 2025..and the big question... Is the Mole at risk from vanishing this year?
This post is inspired by recent visits to explore swallow holes with fellow trustees at River Mole River Watch and river friends Stephen W, a local Mole enthusiast and vanishings expert, and Nick B, the farmer at Swanworth Farm who has a lifetime of knowledge of the River Mole that runs through his farm. I hope this post sparks interest among the many others who share an interest and knowledge of this phenomenon. I invite your insights, thoughts, and observations to foster a community dialogue.


Pictures from June 2025 of river through Swanworth Farm
Initial findings suggest that no single factor causes the river to vanish. While factors such as low groundwater levels from a dry winter, a lack of spring rainfall, a summer drought or heatwave, and low river flow are all important, on their own they are not enough to cause the surface river to disappear and flow entirely underground. Vanishings seem to require some combination of critical factors that come together at the right time in a "perfect storm" to lead to a disappearance.
I've investigated the following questions to help understand the mystery of the vanishing River Mole:
Mapping Swallow Holes in the Mole Gap: Where does the river disappear?
A River Runs Through It: When have River Mole vanishings occurred in the past?
Hydro-geology of the Mole Gap: How does water journey from swallows to springs?
River Flow during Vanishing Events: What do flow records show us about vanishing events?
Vanishing Years : The Data for 1949, 1976 and 2022 and some "Near Misses"!
2025: Will the River Mole Vanish this Summer?
Why Vanishings Matter and Moving Forward
Acknowledgements, thanks and references.
(note: If you read all 7 sections ..then first a huge thank you and well done ... but I'd be delighted if you like, share and comment below. I'll be tweaking this further for a little while but if you spot anything that needs attention then let me know. Simon. :-)
Mapping Swallow Holes in the Mole Gap
Where does the river disappear?
John Speed's 1611 map of Surrey is the earliest document to reference swallow holes. It depicts the river flowing upstream through "Darking" and downstream through "Letherhead," but the section through the Mole Gap is illustrated as a dry channel with the note "The River Runneth Under." This might imply that disappearances were more common in the Middle Ages. However, 1611 was during the Little Ice Age, a time marked by significantly cooler and wetter conditions than today. The River Thames even froze over for the first time in winter 1607-08, just a few years before the map's publication. The effect of these colder and wetter conditions on the frequency of disappearances and the reason for John Speed's annotation remains a fascinating mystery. Could it reflect collective memories from the earlier Medieval Warm Period, when the region experienced several centuries of warm and dry conditions, conditions that are now increasingly surpassed due to climate change?

A century later, in his book "A tour thro' the Whole Island of Great Britain" (first published in 1724), Daniel Defoe provides the best description I've read of the river disappearing into swallows holes.
"...the current of the river being much obstructed by the interposition of those hills, called Box Hill ... it forces the waters as it were to find their way through as well as they can; and in order to do this, beginning, I say, where the river comes close to the foot of the precipice of Box-Hill, called the Stomacher, the waters sink insensibly away, and in some places are to be seen (and I have seen them) little channels which go out on the sides of the river, where the water in a stream not so big as would fill a pipe of a quarter of an inch diameter, trills away out of the river, and sinks insensibly into the ground. In this manner it goes away, lessening the stream for above a mile, near two, and these they call the Swallows." Daniel Defoe 1724
Swallow holes have been mapped numerous times. Possibly the first accurate mapping is a beautiful engraving from 1818 showing "swallows".

Other notable maps include the 1869 6-inch OS edition, shown below, which depicts just 3 swallow holes. One is shown near a short distance upstream of the Stepping Stones and two are shown downstream of Burford Bridge before the railway. All three are further upstream than where we consider active swallow holes to be now.

In 1933 it was the geologists turn to map swallow holes. Edmunds and Dines's 1933 geology map, shown below, identified some 21 swallow holes.

Two swallow holes are shown around the Stepping Stones and more appear on Burford Meadow, these might include the "fossil swallow holes" seen today as wooded depressions on the flood plain and which show up well on the Lidar DTM map below.

In addition, the three swallow holes nearer Burford Bridge might be the ones capped during the A24 construction (Brown, 2019). Several swallow holes are shown on the river through Nichol's Field at Westhumble, including one on the "Abandoned Ox Bow meander". The remaining ten, which include the most active swallow holes locations today, are found on the outside of meander bends which cut into the chalk valley sides. It is these meander-bend locations, mentioned by Peter Brown in his book on The Vanishing River of Box Hill, that seem to be where most of the bank side swallow holes occur as the river erodes into the chalk bedrock and exploits fissures and cracks into which the river drains.
The most famous and extensive investigation of swallow holes was made by C. C. Fagg. As Warden of the Field Studies Council Centre at Juniper Hall from 1948 to 1950, Mr Fagg meticulously surveyed swallow holes over "3 seasons". He identified 25 swallow holes and "many extinct ones" both in the river bed and the flood plain. These he classified into types according to where he found them: river bed, river bank side, valley side or fossil swallow holes usually on or above the flood plain.

Finally, in respect of published swallow hole mapping material, mention must be made again of Peter Brown's excellent book, The Vanishing River of Box Hill 2019, which reviews all of the above and goes into engaging detail on the geology, historic vanishings and highlights the mysterious nature of vanishing events.

A River Runs Through It
When have River Mole vanishing years occurred in the past?


Vanishings along varying lengths of the channel have been reliably documented in the summers of 1949, 1976 and 2022 and a partial vanishing in Summer 2019 along a shorter stretch.

There is also an anomalous drying event in September 2011 but this is less well documented and, although contended, some attribute this to the operation of a hydro-scheme at Betchworth. This event is less reliable as a "natural drying" so is excluded from this data analysis. More of a problem for verifying confirmed vanishing event dates is that Ruby's 1964 "Leatherhead River" essay mentions C.C.Fagg taking people to visit Ham Bank swallow holes in "August 1947" to demonstrate the action of swallow holes.

Following his trip to Ham Bank, Fagg notes, "the large pool remaining in the otherwise dry river bed could clearly be seen to be running away down through the flints in the bed". Furthermore, Ruby mentions "a striking photograph of the dried-up river bed under the tunnel railway bridge (appeared) in The Times of October 10th, 1947" (Ruby 1964). While 1947 is not mentioned elsewhere as a vanishing year it appears twice in this important essay. If a vanishing occurred in Summer 1947 it would be difficult to explain from hydro-meteorological conditions. Summer 1947 came at the end of a wetter than average 12-months with "moderately wet" rainfall and a notably wet spring. Groundwater peaked at "exceptionally wet" levels during spring 1947 and remained moderately higher than average through Summer 1947. Whilst August 1947 itself was "extremely dry", it stood alone as the first and only month in 2 years to be notably drier than normal as shown in the charts below. For us, this means that, if August 1947 did experience a vanishing event it would stand out as highly anomalous given the "normal to wet" antecedent conditions over the previous 2 years. Interestingly, August 1947 was the opening of a much drier period ultimately leading to the 1949 vanishing, as shown below.

As 1949 is so well established as a vanishing event our data analysis uses this year and not 1947 which seems more problematic and somewhat anomalous. However, if anyone knows more about 1947 as a potential vanishing date then please leave details in the comments. Similarly, due to less documentation, we have not used 2019 data for this analysis. Our selected vanishing years are therefore 1949, 1976 and 2022.
As C.C Fagg so aptly put it...
“ After three seasons of close observation I am far from being able to say the last word on these fascinating phenomena” . C.C Fagg
Hydro-geology of the Mole Gap:
How does water journey from swallows to springs?


North of Dorking, the River Mole flows away from the impermeable clays dominating the upper course, and across fractured, permeable chalk bedrock in the Mole Gap. The chalk is riddled with fissures and natural conduits eroded by solution processes.


Two photos of dry channel at Young Street, 1976 and 1949.
Cracks and fractures in the chalk allow river water to drain underground through the swallow holes previously discussed above which occur in the riverbed and banks and follow subterranean channels to emerge at springs as observed by C.C.Fagg in 1947.
The swallowed water, or much of it, reappears in the copious permanent springs on Thorncroft Island. ... The springs in Fetcham pond appear to be fed by other fissures unconnected with the present-day swallows. C.C.Fagg 1947
In very low flow conditions, the entire river may vanish from the surface, leaving a dry, stony bed between Burford Bridge and Thorncroft Bridge, Leatherhead.

As early as 1947, C.C. Fagg documented that much of this water reappears in powerful springs around Thorncroft Island. Nearby springs such as those in Fetcham Pond are believed to be fed by other, unconnected fissures from groundwater. This suggests local groundwater plumbing is complex.

Maps from the British Geological Survey show a concentration of swallow holes upstream and springs downstream, but the precise subsurface pathways remain unknown. While surface flow follows a visible and predictable course, groundwater movement is complex and hidden. Peter Brown succinctly captured the enigma: "Nobody knows the exact course, but downstream the same water bubbles up again and the river flows on as normal until it reaches the Thames" (Brown, p.18). The subterranean journey is critical to understanding the Mole’s behaviour in dry conditions so let's try to dig a little further.

In places where the river erodes into the steeper valley sides, such as near the railway viaduct and Ham Bank, the chalk exposed on the river banks is more "blocky" with cracks and fissures separating the large chunks of chalk. This is where most swallow holes are found as water drains into the cracks between blocks.
Hydrologically speaking, it is unlikely that the springs at Leatherhead deliver only the recycled water that disappeared upstream via swallow holes. Instead, the springs likely draw on a mixture of water sources: percolated river water and groundwater arriving from the North Downs under hydraulic pressure. The proportions and volume will vary by season and groundwater elevation, perhaps something like the diagram I have edited below.

This interaction between river and groundwater is influenced by geology and slope. The gradient along the Mole Gap is minimal—just 7 m drop over 8.3 km—yielding a slope of just 0.08% between Pixham, where the Pipp Brook joins the Mole and Bluebird Island at Thorncroft, Leatherhead. Historical surveys (Ruby, 1964) recorded an even shallower gradient between Ham Bank and Thorncroft Bridge.
"...between Ham Bank and Cowslip Bank (about a half-mile), Mr. C. C. Fagg found, by levelling the dry bed of the river, that the net fall was only eleven inches and that in the 2 miles from Ham Bank Corner to the permanent water at Leatherhead, the overall gradient was one in twelve hundred" Ruby, 1964
Such a modest slope might seem to inhibit underground flow, but this is not the case. In karst systems, during periods of low water table with a heightened risk of vanishing, river water percolating into vertical fissures will descend to the water table under the valley floor before moving laterally along pathways controlled by pressure gradients. In this case, the higher water table in the North Downs may provide the hydraulic head needed to push water to the springs. This pressure gradient will be enhanced where the chalk meets impermeable London Clay at Leatherhead.
Seasonal Variation and Spring Water Provenance
Seasonal changes in water table height likely determine whether springs are fed more by recent river infiltration or deeper, older groundwater. In summer 2024, our temperature and E.coli testing showed an insight into this. The river water tested near the springs at Thorncroft in Leatherhead was markedly cooler and cleaner than river water upstream of the swallow holes and in particular prior to the river entering the Mole Gap—suggesting a proportion of spring discharge coming from deeper groundwater sources rather than only the warmer, less "clean" river water arriving via the swallow holes. However, we are perhaps making too big an assumption that a rapid transfer of the polluted and warmer river water underground will retain a higher temperature and more E.coli than groundwater. Nevertheless, it is an intriguing finding and one worth following up with further tests.

Studies of karst systems elsewhere support the view that the springs resurge a mix of groundwater and river water. Rapid flow paths may carry the river water from swallow holes underground in hours, while slower paths—characteristic of deeper aquifer contributions—may have residence times of weeks to months. However, whilst journey time may be slower for groundwater, springs can still experience sudden changes in flow as we shall see further on. The river water mixes with the cooler, more chemically buffered groundwater before emerging at Thorncroft. This is why it is perhaps somewhat safer to paddle and swim at Thorncroft than it is at Dorking.

River flow between Dorking (upstream) and Leatherhead (downstream) gauges shows only a modest difference with only one tributary, the Pipp Brook, and Dorking sewage treatment works, adding to the flow of the Mole between the two gauges. The average flow at Leatherhead (4.0 m³/s) is only slightly higher than at Dorking (3.8 m³/s), an increase in flow of 0.2 m³/s through the Mole Gap at average flow conditions.

In average conditions, Pipp Brook might typically contribute ~0.10–0.15 m³/s and a typical flow of treated effluent from Dorking STW ~0.01 m³/s so it is reasonable to attribute the majority of the 0.2 m³/s increase at Leatherhead to these two sources.

Under average conditions, the flow entering the Mole Gap is comparable to the flow leaving it. This suggests that, although the springs at Leatherhead might alter the water's composition, they don't significantly increase the river's flow. As the springs are very likely augmented by groundwater, this raises the question of what happens to any lost river water?

Karst Complexity and Unsolved Mysteries
Some studies do indeed propose that not all swallowed water resurges—some may join groundwater flows leading to other basins, possibly the Wey. Such cross-catchment transfers are plausible in complex chalk geology. However, no dye-tracing experiments have definitively confirmed a connection between individual swallow holes and Leatherhead springs or elsewhere, although hydrological patterns noted above strongly suggest one. There is still much to find out, however, below is a suggested model of flows discussed so far and how they might account for our vanishing river.

Borehole investigations have identified conduits ranging from 1–10 cm wide at various depths. In one case, Bull et al. (1932) found sand 30 m below ground in a borehole near Leatherhead, pointing to surface connectivity. Elsewhere in the North Downs, sediment-filled voids have been found over 100 m deep, indicating dynamic surface–subsurface interactions.
The Mole Gap chalk is not uniform. Near Ham Bank and the viaduct, the river cuts into steep banks of blocky chalk, which fractures more readily and seems conducive to swallow hole formation. Elsewhere, particularly near Swanworth Farm, reworked chalk and flint hint at solifluction deposits from the Ice Age. These variations affect where and how water enters the subsurface system.

Swallow holes form and evolve over time. They are most often observed on river sides where water visibly drains into cracks in exposed chalk, particularly on the outside bends of meanders where the river actively erodes into chalk rock. Some swallow holes may become blocked due to deposition of silt on the bed or banks collapsing, while new ones appear via erosion.


Bed-based sinks are harder to spot, possibly masked by sediment, yet must be active during vanishing events. As river levels fall, bank swallow holes are left dry while bed sinks continue to drain flow.
To conclude this section, the chalk below the Mole Gap flood plain is a constantly evolving underground labyrinth. It functions like natural plumbing: sometimes capturing and storing flow, sometimes delivering flow back to the river. The water issuing from springs downstream are very likely a mixture of groundwater and river water. It is the result of complex groundwater dynamics that deserve greater study. We will come back to the issue of spring flow later.
Future research might include tracer tests, high-resolution mapping, and continued local monitoring. This will help reveal more of the hidden journey of the River Mole, and how this chalk stream adapts to climate stress and seasonal change.
River Flow During Vanishing Events
What can flow and level records show us about vanishing events?


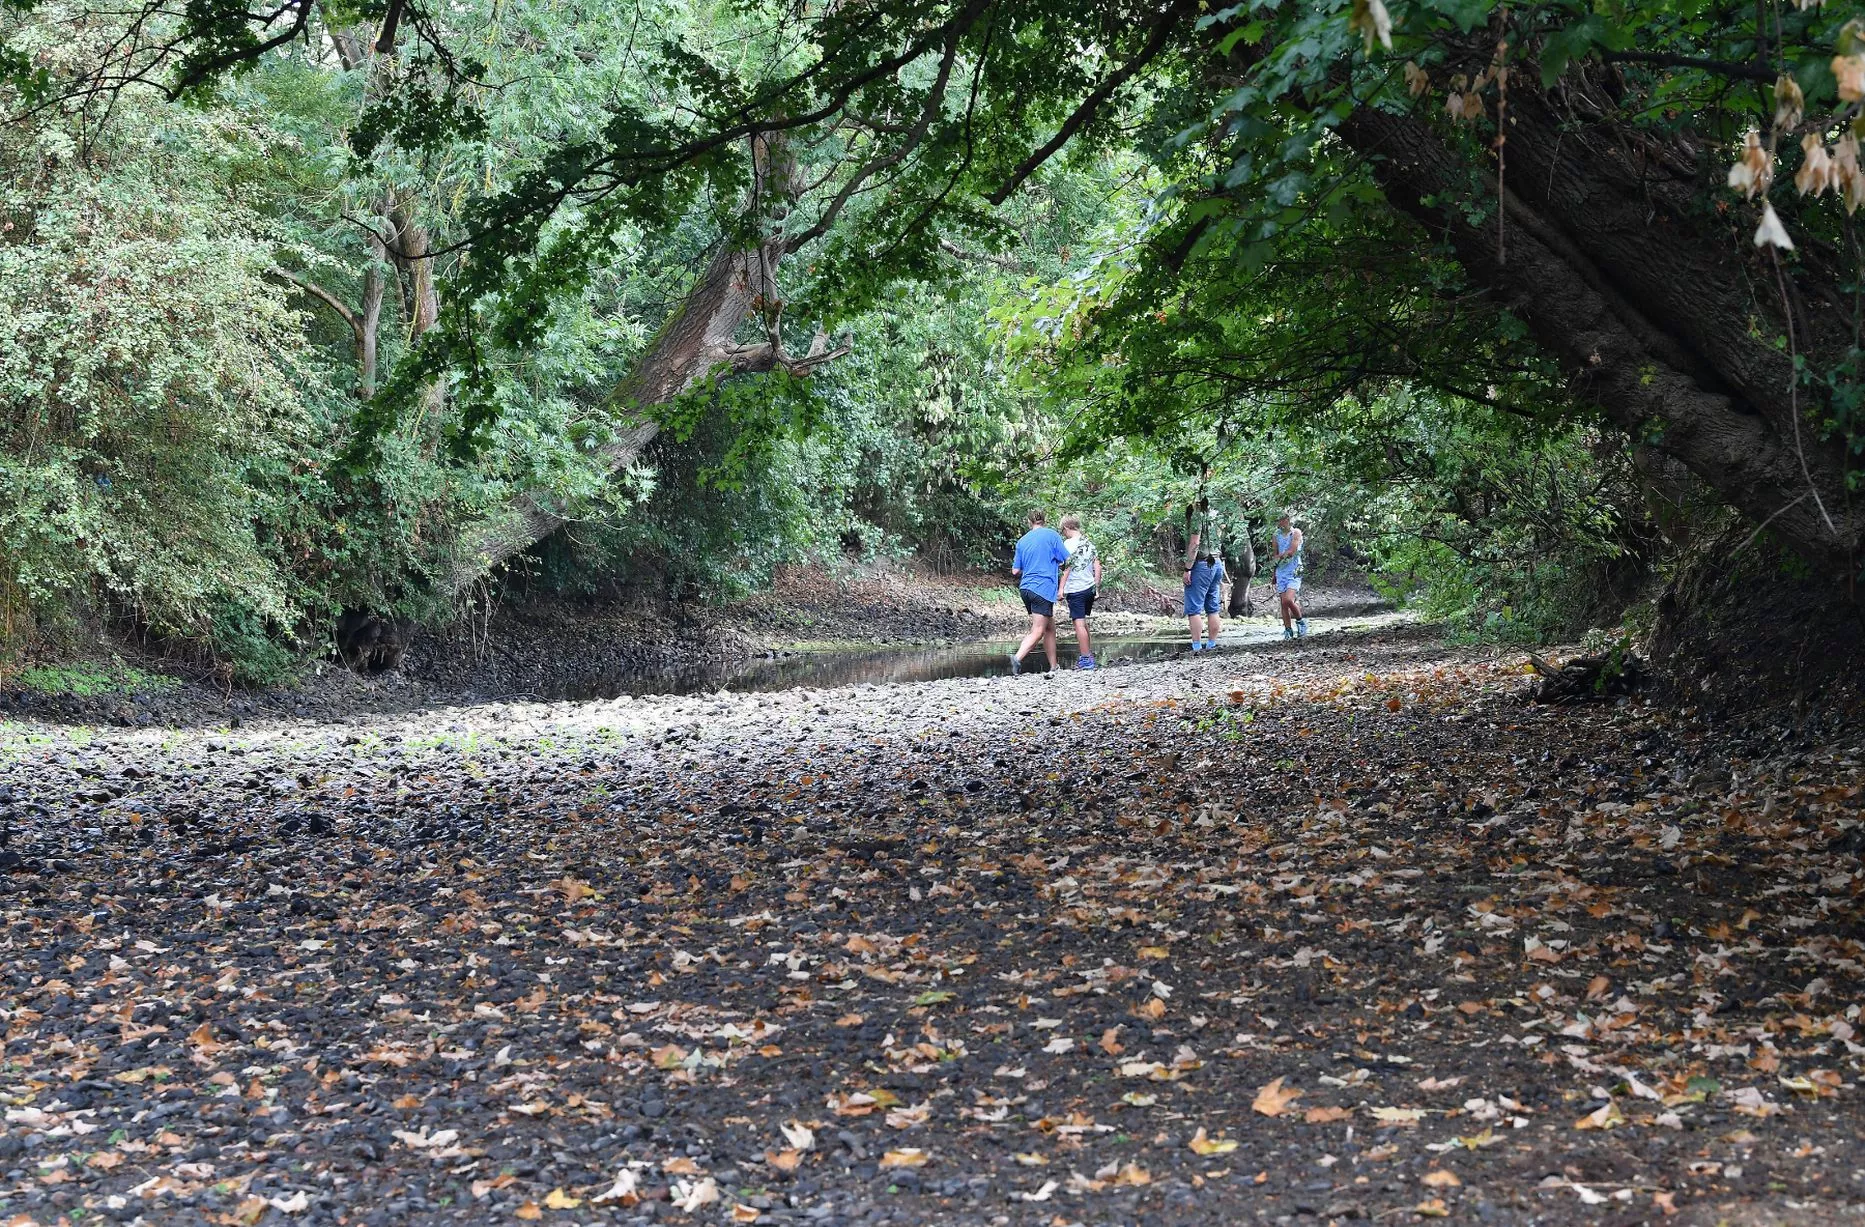


During the summer of 2022 the River Mole vanished between Norbury and Young Street for 42 days from 14 July to 24 August. Photos here of the July vanishing include my own and a variety of sources.
Flow in rivers is known as discharge and is usually measured in metres cubed per second (cumecs m³/s). I'll continue to refer to "flow" to avoid confusion with effluent discharge. Normally, flow increases downstream as tributaries and groundwater progressively add to the volume of rivers. In some references to the River Mole, mention is made of discharge decreasing downstream between Dorking and Leatherhead, which makes sense due to the loss of water into the chalk but is possibly something of a local myth. However, long term EA flow data does not fully support this.

Averaged out over the full record for each gauge shows the mean flow and 95% exceedance low flow parameter are both higher at Leatherhead than Dorking, showing flow increasing modestly downstream. The EA river gauge at Dorking shows an average flow of 3.8 m³/s while the average flow at Leatherhead is 4 m³/s showing no overall reduced flow in "normal" and low river conditions.


The flow gauge at Leatherhead (downstream of Town Bridge shown) .. in normal and low flow conditions (left) flow is usually greater than Dorking
Counterintuitively, for highest flows, the 5% exceedance "flood" parameter is higher at Dorking than Leatherhead. Indeed, this was found at times during the 2013/14 floods when the gauge at Dorking recorded periods of higher discharge than Leatherhead at peak flood conditions. This can occur due to topography, gradient, larger flood plain storage or structures holding flood peaks back to create local surges of flow. However, our concern here is with low flow and, notwithstanding during vanishings, in most conditions there is little evidence of the flow of the River Mole decreasing markedly or for sustained periods through the chalk Mole Gap.
Flow Parameter / Gauge | Dorking | Leatherhead |
Mean Flow m³/s | 3.8 | 4 |
Low Flow parameter (95% exceedance) | 0.8 | 0.9 |
High Flow parameter (5% exceedance) | 14.4 | 13.3 |
However, close inspection of periods of low flow, such as right now in summer 2025, and during vanishings, such as summer 2022, show periods when the flow at Dorking exceeds Leatherhead. As the river enters very low flow conditions, flow at Dorking and Leatherhead seem to change and this might provide further potential insights into the underground plumbing system and relative provision of groundwater and river water to downstream springs. Let's have a look at each.

The chart above illustrates river flow during the dry summer of 2022, showing the run-up to the River Mole's vanishing through the Mole Gap. As expected, Leatherhead flows were consistently higher than at Dorking throughout early July, due to the contributions of flow from Pipp Brook, Dorking STW effluent, and possibly groundwater-fed springs at Thorncroft which are upstream of the Leatherhead river gauge.
Leading up to the vanishing on 14 July, both gauges initially responded similarly to small rain events, with the typical lag of around 6–7 hours between upstream and downstream peaks. However, from around 11 July, an interesting pattern emerges: while flow at Dorking held a continued slow steady decline, at just over 0.7 m³/s, Leatherhead showed a sharp dip then a sustained increase—from 1.08 to 1.24 m³/s— despite no recorded rainfall.

Does this divergence suggest a possible shift in the flow regime: as surface flow diminished and was lost into swallow holes, groundwater resurgence at Leatherhead may have intensified, temporarily sustaining downstream discharge? The event and more unstable flow at Leatherhead seems to align with known karstic spring behaviour, where spring output can vary rapidly with changes in subsurface pressure, flow path saturation, and antecedent groundwater levels.
The end of the vanishing period, 42 days later, sees flow at Dorking momentarily exceeding flow at Leatherhead. This is likely because rainfall delivered an increase in surface discharge arriving to upstream gauges before those downstream. This surface river flow would have reoccupied the dry channel through the Mole Gap before reaching the gauge at Leatherhead augmented by spring flow.

In stark contrast to typical seasonal behaviour, the flow records for Summer 2025 displayed above indicate that river discharge at Leatherhead has consistently been approximately 0.1–0.3 m³/s lower than at Dorking—an intriguing and more persistent reversal of the usual pattern. This may suggest that water entering swallow holes through the Mole Gap is somehow not yet fully reappearing at the springs downstream.

There could be measurement issues with the gauges at low flow. It is not uncommon for incorrect reporting to occur at very low river levels. However, the Leatherhead gauge was refurbished recently, and the Dorking gauge typically provides reliable monitoring. Furthermore, as shown above, both gauges are reliably recording the regular ups and downs of river level (shown best in level output, not discharge) due to the peaks of treated effluent arriving from upstream sewage treatment works. This means we can assume the gauge measurements are accurate. The data therefore raises the question: where is the missing flow going?
Several possibilities arise: is spring flow currently being suppressed due to groundwater lag or depletion after a very dry spring, or is water being temporarily stored within deeper conduit systems? Does this odd 2025 flow behaviour suggest the River Mole is primed for a partial vanishing event, with only limited spring resurgence—a phenomenon not typically seen at this stage in previous dry years?
Let's move on to looking at river level during the 2022 vanishing event in detail...it reveals further intriguing insights into spring flow and the provenance of water issuing from springs.
Interpreting River Levels During the 2022 Vanishing Event

The chart above compares river levels—not flow—at Dorking and Leatherhead during the River Mole’s vanishing episode in July and August 2022. Levels are shown in metres above stage datum (mASD), which references a fixed point above the riverbed.
At Dorking, upstream of the Mole Gap, river levels remained relatively steady throughout the vanishing period, with a gentle decline. The regular daily fluctuations—labelled “tides” on the chart—are caused by the predictable discharge cycle from upstream sewage treatment works. No significant spikes in level were recorded until mid-August. Following rainfall on 16–17 August and a larger event of over 20 mm on 24 August, levels rose more sharply. This likely marked the reoccupation of the dry riverbed downstream.
At Leatherhead, the pattern is more variable. Levels start July fairly constant but there is a steep and consistent drop in level from later in July through to 9 August which has no corresponding change at Dorking. While the same daily effluent “tides” are visible at Leatherhead, they are interrupted by several sudden increases in level—“spikes”—particularly on 9 August. Notably, these spikes are not preceded by rainfall and have no corresponding change at Dorking.
This suggests the Leatherhead spikes may be caused by brief surges in groundwater discharge from the Thorncroft springs, independent of surface rain or upstream flow. Such behaviour is consistent with karst spring dynamics, where pressure and flow can vary rapidly in response to subsurface conditions.
Another key insight is the consistent presence of the effluent “tide” pattern at Leatherhead, even during the vanishing event. Since no known sewage outfalls exist between the springs and the Leatherhead gauge, it is reasonable to infer that a significant portion of this “tidal” signal—possibly the effluent itself—is resurfacing via the springs. This raises the possibility that treated effluent contributes substantially to the spring flow at Thorncroft during very low-flow conditions.

Vanishing Years : The Data for 1949, 1976 and 2022
The final section compares data for vanishing years (1949, 1976, 2022) with selected non-vanishing years (2018, 2017, 2014, 2012, 2011, 2003, 1995 and 1992) using the following parameters:
SGI (Standardised Groundwater Index, 1 month) 1 month was chosen because changes in groundwater seem to occur on a month to month trend responding to rainfall falling over the last 6 months.
Groundwater Level (Chipstead borehole, mAOD) Although not in the Mole catchment and situated on the North Downs, the Chipstead borehole is the closest chalk borehole to the Mole Gap and has a very long record of data stretching back to 1942. The floor of the Mole Gap is 35-40mAOD so Chipstead groundwater levels, which average 94mAOD on the North Downs, are used as a proxy for overall water table level rather than a local reading.
SPI-6 (Standardised Precipitation Index, 6 months) 6 month SPI was chosen because groundwater level locally appears to respond to winter rainfall over the 6 months to spring.
Monthly rainfall (total accumulated rain and % of normal) Normal rainfall is calculated as long term average
River flows at Horley, Dorking, Leatherhead (m³/s) Dorking is upstream of the swallow holes while Leatherhead is downstream of the resurgence springs where the river upwells back into the channel. The river emerges in what appears to be full flow condition, at least equalling the flow that disappeared into swallow holes upstream. However, the provenance of water upwelling from springs in the channel from Thorncroft Bridge north through Leatherhead and into Fetcham is uncertain. It seems these springs flow continuously and augment river flow at all times of the year. Tests have shown temperature and E.coli levels to be significantly lower near these springs than in upstream river water suggesting the springs may contain a proportion of cooler and "cleaner" groundwater rather than simply river water recycled to remerge from a journey from the swallow holes upstream.
Flow difference: Dorking - Leatherhead Rivers usually increase flow volume downstream. The average flow at Dorking is 3.8 m³/s while the average flow at Leatherhead is 4 m³/s. At certain times, especially in low flow, the flow at Dorking can exceed that at Leatherhead.
Analysis of hydrological records shows no single trigger or cause. Instead, each vanishing event seems to have its own fingerprint and occurred when unique critical combination of low rainfall, declining groundwater, and minimal summer river flow aligned. It could be that any combination leading to low flow will cause a vanishing or is there a threshold that needs to be met to trigger the channel to dry out? To help find predictors, detailed seasonal data is used to identify any consistent patterns. Let's look at the antecedent conditions leading to each vanishing year in turn.
1949: A Slow-Onset Drought

During late 1947 into early 1948, southern England experienced extended dry spells, culminating in widespread “absolute drought” by October 1947 which continued into 1949. By June 1949, rainfall across southern regions was sharply below normal, triggering reports of drought conditions affecting agriculture and river flows. Groundwater indices in the Mole catchment reflected a strong signal of drought, for example the 6 month SPI was -2.4 by June 1949. Despite no river flow data from the time, such a big rainfall deficit almost certainly caused a drop in baseflow to very low levels. The combination of preceding dry winters/springs primed the chalk aquifer, reducing recharge and setting the stage for the dry summer of 1949 to cause the River Mole to "vanish" along a considerable stretch from Mickleham to Leatherhead.
☀️ 1976: The Classic Heat-and-Drought Combo

The winter of 1975–76 was exceptionally dry, followed by a spring with minimal rainfall. By late July, groundwater across southern chalk regions had dropped below normal and was among the lowest ever recorded for the time of year (July 1976 89mAOD, November 84mAOD). The summer was accompanied by the infamous 1976 heatwave (with temperatures frequently exceeding 30 °C for days on end) and July and August rainfall was nearly absent with some areas seeing 45 consecutive dry days in July–August. These conditions led to one of the most severe groundwater and surface flow drawdowns in modern UK history, clearly enabling the River Mole to vanish into the chalk swallow holes through the Mole Gap. It was, hydrologically speaking, a perfect storm.
🔥 2022: Rapid Rise Into Drought

Autumn 2021 through winter rainfall was variable with patchy groundwater recharge. October was the only month in the recharge season with above average rainfall, while November had exceptionally low rainfall and January only reached notably low rainfall with the other months just "normal". Overall, rainfall was just 75% of normal and this meant groundwater levels fell rapidly and failed to peak as high as normal entering spring. Thereafter, spring 2022 saw increasing aridity; by June, rainfall had dropped dramatically, leading to England’s driest start to a year since 1976. England recorded its driest July since 1935 with the River Mole catchment recording less than 2.4mm, just 4% of expected rainfall for the month. The sustained heatwave, high evaporation rates, and exceptionally low summer rainfall led to continued groundwater decline to 92mAOD in July and 89mAOD by August. The faltering winter and spring rainfall, lack of summer rain to sustain river flow, and summer heatwave depleting baseflow all combined with the low groundwater to cause the summer 2022 vanishing event in the Mole Gap.
Near misses?
It's important to recognise that some years nearly satisfied the conditions for drying, yet the Mole continued to flow. Summer 2012 followed one of the driest 18-month period in England's history and 2006 came at the end of a period of 2-years with low rainfall and falling groundwater levels. Neither experienced vanishings.
🌞 Summer 2006: Long Drought, Low Groundwater but Resilient River

2006 was the worst drought since 1976 in South East England and followed two dry winters with below-average rainfall. Groundwater levels in chalk aquifers of the North Downs fell through winter 2005-2006 and by late winter had created one of the most severe groundwater deficits in recent decades. Groundwater averaged 88mAOD in JJA 2006 which was lower than all the vanishing years with JJA levels of 91.8mAOD in 2022, 89.7mAOD in 1976 and 90.1mAOD in 1947.
The River Mole kept flowing through 2006 despite lower summer groundwater levels than all years with vanishings.
South East England then went on to experience a record-breaking summer heatwave in July with the Mole catchment exceeding 30°C on 10 days during the summer including 35°C on 19 July — intensifying evaporation. Despite low rainfall over the 2 preceding years, low groundwater levels and a hot summer, there were no reports of the River Mole vanishing in summer 2006. The sporadic rainfall arriving in dry/wet periods meant the usual spring time groundwater peak was delayed until very late in July at just 88mAOD, in the "notably low" range.
What seems to have saved the river from vanishing was the gradual recovery in river flow through July and August. A plausible reason for sustained surface river flow is that catchment rainfall from February to April was "normal", May was "exceptionally" wet with 186% of rainfall and, while June and July were below average (24% and 27% of rain respectively), August had 119% of normal rain in frequent episodes of rainy weather throughout the month.

The result of this rainfall can be seen in the gradual recovery of river flow at Horley shown by the blue line for 2006 below. Whilst 0.8m3/s is still low flow, the increasingly frequent and "normal" rainfall through later July and August appears to have been sufficient to keep the river flowing through July and especially August despite all the other parameters being primed for a vanishing,

The chart above shows flow in the River Mole at Horley. It's clear the two vanishing years of 1976 and 2022 have lower river flow especially through July and August (there's no data for 1949). The average flow at Dorking through the summer of 2006 was 1m3/s, compared to 0.9m3/s in 2022.
🌧️ Spring–Summer 2012: From Drought into Flood


The 2011–12 winter brought dry conditions to southern England, leading to groundwater levels in chalk aquifers at near-record lows by early 2012 . Cities imposed hosepipe bans as river flows shrank. However, a dramatic shift occurred in April 2012, when southern England witnessed its wettest April in over 100 years, with persistent heavy summer rainfall and flooding through June and July . This rapid recharge reversed groundwater deficits and ensured the River Mole continued flowing through the Mole Gap, illustrating how timely spring rain—even after entrenched aquifer depletion—can keep the river flowing above ground.
Will the River Mole Vanish this Summer 2025?
So where does 2025 stand regarding a potential Vanishing River Mole event?
Compared to other vanishing years, the conditions so far leading up to Summer 2025 are not as severe. The vanishing in 2022 was preceded by a dry Autumn '21, dry Winter and dry Spring whereas this summer has been preceded by a wet Autumn '24, average Winter but a very dry Spring.

As recharge occurs mostly in Autumn and Winter, we find that Chipstead groundwater levels at currently >96 mAOD in June are healthy and above thresholds associated with past drying years.
In all previous vanishing years groundwater fell below 90mASD by August. Is this a threshold?
Groundwater can decline by a few metres per month and so could feasibly fall to nearer critical thresholds given a continuation of below normal rain in July and August. This summer could test the extent to which groundwater levels are important to vanishings.
River flow in July 2022 at Dorking fell to <0.7 m³/s prior to vanishing and fell as low as 0.63 m³/s by mid-August. Currently, in late June 2025, flow at Dorking is 0.91 m³/s. This is low but above previous "vanishing" flows.
River flow in July 2022 at Leatherhead fell to 0.9 m³/s on 11 July just prior to the onset of vanishing upstream but, as mentioned previously, flows then increased over 1 m³/s without rainfall input until early August when the flow declined to a low point of 0.75 m³/s on 8 August. Currently, in late June 2025, flow at Leatherhead is very low at 0.78 m³/s. This is where some mystery remains regarding what is happening to river water currently disappearing into swallow holes...is being lost from the system?

Visiting the river in the Mole Gap over the last few days shows the river is falling but is still flowing across riffles about ankle deep.
Talk of the River Mole vanishing this summer arises because of the low Spring rainfall in the catchment —only around 50 mm from March to May, with March being especially dry with just 3.8 mm which is only 6.2% of normal rainfall and May’s 23 mm a mere 39% of normal. Cumulative rainfall since December (300.2 mm) is close to the 360 mm threshold seen in past drying years. With recent rainfall has been paltry so this is cause for concern with May's SPI -1.15 indicating ongoing dry conditions, though not yet at the extreme levels of 1949, 1976, or 2022.
The table below shows current indicators and possible thresholds or warning levels based on previous vanishing years.
Indicator | 2025 Value | Vanishing Threshold (experimental) | Status |
Spring Rainfall (MAM) | 52.4 mm | <100 mm | 🔴 Severe deficit |
6-Month Rainfall Index (SPI-6 JJA) | –1.1 (May) | <–2.0 | 🟡 Moderate drought |
Groundwater Index (SGI-1 JJA) | +0.1 (May value) | <–1.0 | 🟢 OK but declining |
Dorking Flow | 0.9 m³/s | 0.7 m³/s | 🟡 Low |
Leatherhead Flow | 0.6 m³/s | <0.9 m³/s | 🔴 Very Low |
Of course, the most compelling driver would appear to be the lack of rain leading up to each river - vanishing summer! 2025 currently features in the 10 Ten driest years since 1931 which also include the three vanishing years. However, there are 6 other dry years when vanishings didn't occur or were not reported.

If July and August bring less than 30 mm per month (<50% of normal rain) the risk of Vanishing will increase especially in August as groundwater levels will take time to lower. The chart below shows how 2025 does not quite share the same run of dry seasons as other "Vanishing Years". In particular, autumn 2024 was wet which bucks the trend shown in the other vanishings. However, the record dry spring of 2025 is clearly of concern and the summer continues to bring lower than normal rainfall with no return to prolonged rainfall in the models at the time of writing, except possibly thunderstorms which is late June.

A vanishing may also depend on the nature of rainfall as low intensity light rain over long periods will have less impact on river levels than intense deluges where runoff is more likely to reach the river in summer.
A slide in SGI to -0.8 or lower and SPI to -2.0 in July would also increase the risk.
For now, the signals from data and on the ground evidence, suggest the river is not at risk from drying imminently. However, the next few month could tip the balance, especially given the low spring rainfall and declining river flow, especially the strange behaviour of current low flow at Leatherhead.
Why Vanishings Matter and Moving Forward


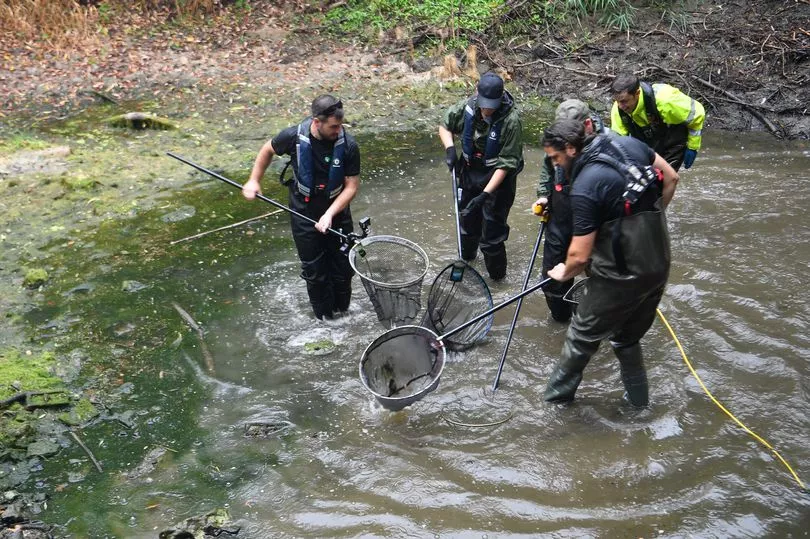


When the Mole Gap dries up it potentially disrupts habitats for fish, invertebrates, and plants, and might cause higher concentrations of pollutants to enter groundwater. A fish rescue took place in 2022 to replace struggling fish in drying pools.
The River Mole's vanishings are not just natural curiosities—they are signals. As climate change drives more frequent and intense droughts, understanding how rivers like the Mole respond is critical. Our analysis suggests that no single factor causes vanishings; rather, a combination of low spring rainfall, declining groundwater, and reduced summer river flow converge somehow to trigger the event at some, as yet unknown, threshold.
As Summer 2025 continues, we could be at risk from another vanishing—monitoring the balance of rainfall and groundwater through summer months will be key.
Moving forward, targeted research like tracer studies, groundwater modelling, and continued community-based monitoring could help unravel the hidden hydrology of the Mole Gap. By learning more, we can better protect our extraordinary river—both above and below ground.
Acknowledgements and Thanks
My sincere thanks go to Nick Bullen and Stephen Walker for their deep knowledge and the many insightful conversations we’ve shared during our field visits to the swallow holes. A special thank you to Nick for generously allowing access to the river across his land and for being such a thoughtful and committed steward of the Mole.
This post draws on analysis of hydrological and meteorological data from sources including the UK Water Resources Portal, Starlings Roost Weather Station (Charlwood), British Geological Survey (BGS) maps, EA Hydrology Data Explorer and the BGS Karst Report Series. My expert son coded an excellent live discharge chart for all Mole gauges so my thanks to Ed Collins for his time and expertise in creating this amazing resource for me. I’ve also referenced Peter Brown’s excellent book The Vanishing River of Box Hill and historical accounts from the Leatherhead and District Local History Society archives including A.T Ruby's seminal work on the river which is fascinating. Many photos and videos are my own, along with numerous contributions from friends and also media from websites including the Mole Valley Geological Society (MVGS). If I’ve overlooked any necessary references or credits, please don’t hesitate to get in touch.
Links:
Mole Valley Geological Society https://www.mvgs.org.uk/geomorphology
British Geology Survey BGS Karst Report Series: C6. Karst in the Chalk of the North Downs https://nora.nerc.ac.uk/id/eprint/531399/1/OR20064.pdf
Fish Rescue August 16-17 https://www.leatherheadangling.co.uk/river-mole-fish-rescue/
Surrey Live report https://www.getsurrey.co.uk/news/surrey-news/gallery/pictures-fish-rescued-river-mole-24797394
RUBY, A. T., The Leatherhead River 1964 reprinted 1988-89 in Proceedings of the Leatherhead & District Local History Society. 5 (2), 44 -64. https://leatherheadhistoryarchive.org/wp-content/uploads/2019/04/VOL_5_NO_2_1988_89.pdf#:~:text=THE%20LEATHERHEAD%20RIVER,the%20parts%20into%20a%20volume.
EA Hydrology Data Explorer https://environment.data.gov.uk/hydrology/explore