
River Mole October Water Quality: Late Rainfall Provides Some Relief After Dry Spell💧
- Nov 12, 2025
- 6 min read
Here’s our October round-up from River Mole River Watch citizen-science testing across the River Mole and a dip into exciting data from the new AquaWatch live "Waka" sensors installed in September.


October’s long dry spell finally broke with some substantial rain in the days just before our test weekend. This brought a welcome fall in phosphate, nitrate and ammonia levels after very high concentrations were measured during the dry spell with low flow in September and early October. The new AquaWatch sensors captured this change beautifully, showing oxygen recovery and dilution after weeks of low-flow stress.

However, this underlines how vulnerable the Mole is to damaging low-flow pollution concentrations.

Tributaries in the Upper Mole fall quickly to low flow due to the predominance of impermeable clays in the upper basin and a subsequent dearth of base flow to "keep rivers flowing" through dry spells. Some smaller catchments, like Gad Brook, dry out completely.
October Overview

October brought some long-awaited rainfall, mainly towards the end of the month. The catchment stayed mostly dry through the first three weeks, with river flows well below average.
Then, as gauges across the catchment recorded nearly 25-30mm over 19–23 October prior to our test days on 25-26 October, the Mole showed a rise in flow as shown at the Leatherhead gauge below.

Sufficient rain fell in the latter part of October to exceed the long term average total expected for the month.

The extra water helped to dilute nutrient concentrations that had built up through the dry spell.

Storm Overflows
The chart below shows how storm overflows were triggered during the rainfall around 20-23 October.

Burstow STW topped the storm overflow duration table at over 100 hours in October. However, a number of EDMs (event duration monitors) are offline including Horley STW and Earlswood STW. It is very likely that Horley STW discharged untreated effluent into the Mole during this period. The Horley EDM has been offline since August. Thames Water has been asked to respond.
Meanwhile, Millbank CSO in Crawley has shown a notable increase in EDM storm overflow activity over the last several years. This storm overflow discharges into Ifield Brook just below Ifield Mill Ponds. We are asking Thames water to explain this trend.


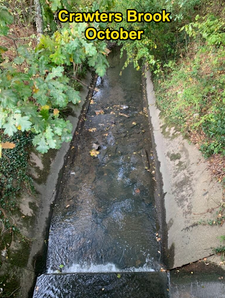
Photos from our fantastic volunteer citizen scientists of stretches of river during test weekend show increased flows, highest in middle sections of the Upper Mole at Sidlow and Castle Mill.


Phosphate

Average catchment phosphate concentration fell sharply from September’s high:0.57 mg/L in October compared with 1.02 mg/L in September.

The late-October rain burst (27 mm at Charlwood in the 3 days preceding testing) and corresponding increased river flow provided clear dilution effects — exactly what our volunteers observed during sampling.

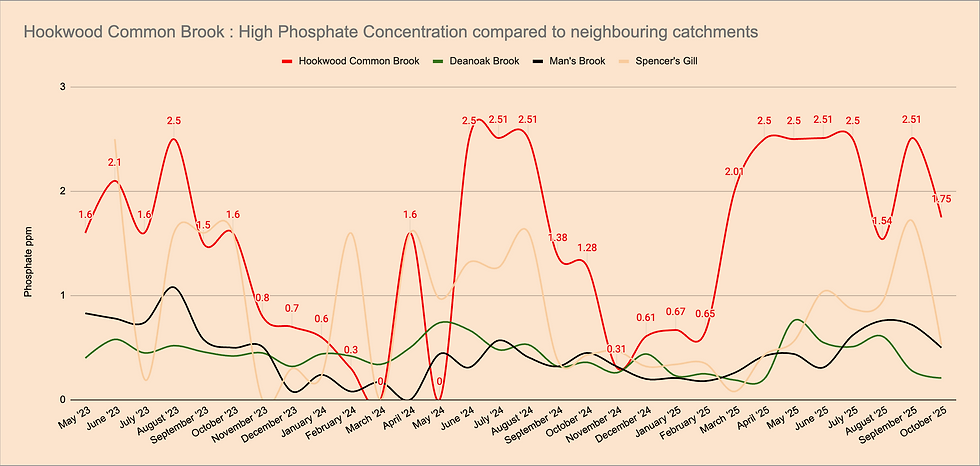
However, hotspots of phosphate concentration remain as shown above:
Leigh Brook stayed stubbornly high at 2.51 mg/L (the only “Bad” site this month).
Hookwood Common Brook, Redhill Brook, and Salfords Stream also showed “Poor” levels.
There were, however, big improvements across the main river particularly in the stretch of the Upper Mole from Horley downstream to Dorking.
West Vale Bridge dropped from 2.14 → 0.29 mg/L,
Sidlow from 1.41 → 0.05 mg/L,
Stepping Stones and Castle Mill Dorking both roughly halved.
Earlswood Brook has continued to show some of the lowest phosphate concentrations in the catchment at 0.15 mg/l despite the STW discharging upstream.
The chart below shows phosphate concentration overall fell more sharply in the Upper Mole than the Lower Mole following the unusually high peak in September.

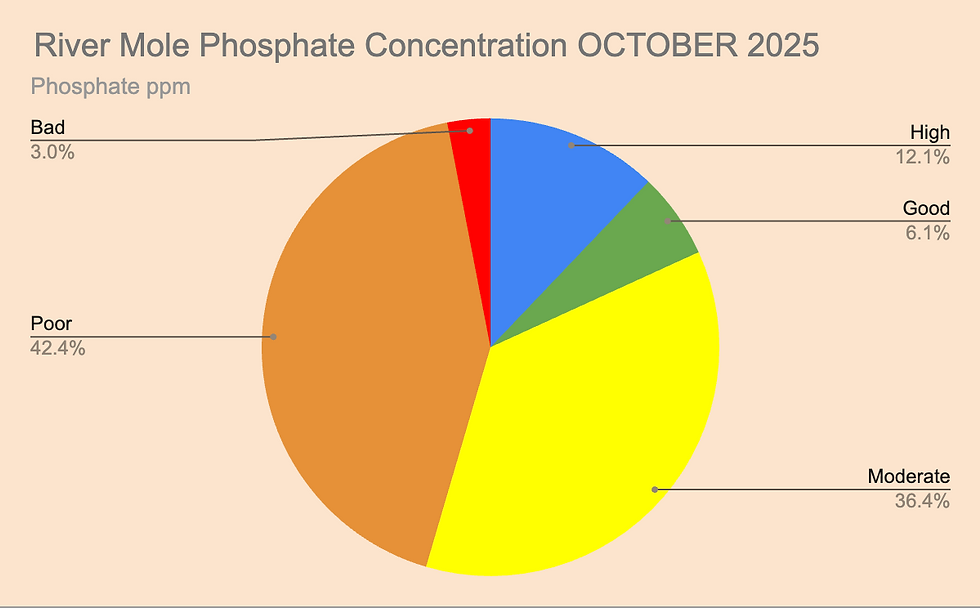
Overall, while 42% of sites improved, the catchment still shows 82% Moderate-Poor-Bad with only 18% High-Good water quality. Streams with STWs still recorded more phosphate than those without.

Nitrate
After September’s alarming spike, nitrate levels fell dramatically:from a mean of 27.0 mg/L down to 10.5 mg/L.

Most tributaries and the main Mole saw reductions in nitrate concentration of 50–80 %. The most pronounced fall was the stretch from West Vale to Dorking where all sites showed a notable reduction in nitrate concentration from September e.g. West Vale 91.4 mg/L to 5.6 mg/L. The main river through to Leatherhead also improved — averaging about 9 mg/L, down from over 50 mg/L in September, mainly driven by the decline at Fetcham Splash. However, Nitrate levels at Swanworth Farm in the Mole Gap are still the 4th highest of all readings in the catchment 21.3 mg/L which is classed as Bad water quality.
Top nitrate hotspots were Earlswood Brook 59.9, Deanoak Brook 39.5, and Gatwick Stream 33.4 mg/L.

Notable outliers were Deanoak Brook (up from zero to 39.5 mg/L) and Tanners Brook (up to 14.9 mg/L).
Overall, 70% of tests fell into Moderate-Poor-Bad water quality with 30% High-Good.

Ammonia
Overall, ammonia concentration followed the same downward trend as phosphate and nitrate: with an October ammonia average of 0.21 mg/L compared to September's 0.34 mg/L. The median value stayed low at 0.1 mg/L.

Several small brooks improved markedly: Hookwood Common Brook went from 4.4 → 0.4 mg/L.

Wallace Brook (shown below) and Leigh Brook remained elevated.

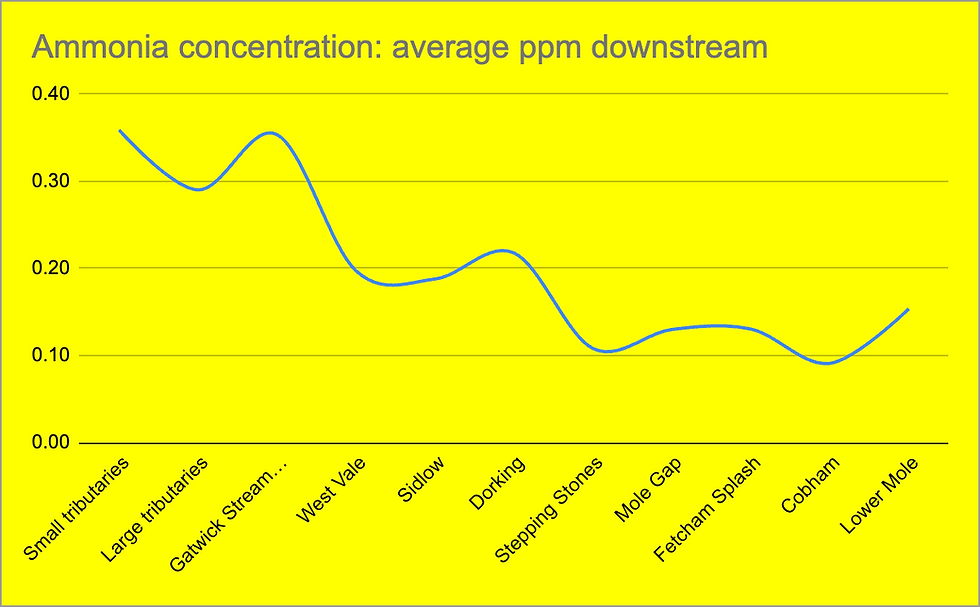
Downstream, Ember Lower Mole rose a little, possibly reflecting peak flows arriving more slowly after the late-month rain.

Overall, average ammonia continues to show a strong decline downstream despite the uptick in the farthest reaches of the Lower Mole.
Temperature


New AquaWatch live sensor data — an early snapshot of draft data


A huge thank you to AquaWatch Solutions for providing the four pilot sensors now operating on the Middle Mole. Of particular interest is the sensor upstream at Castle Mill, above the Dorking (Pixham) sewage-works outfall, compared to the sensor downstream near the Stepping Stones. Both have been recording water quality every 15 minutes since early September.


What the sensors show
During October, both sensors captured the build-up of pollutants during the long dry spell and the gradual improvement as rain arrived late in the month.
Variable | Upstream (Castle Mill) | Downstream (Stepping Stones) | Interpretation |
Water Temp (°C) | 13.2 (mean) 10.8–15.2 range | 13.4 (mean) 10.9–19.3 range | Seasonal cooling but slightly warmer peaks downstream. |
pH | 7.7 (mean) range 7.4–8.1 | 7.4 (mean) range 5.3–7.8 | Generally near-neutral; occasional brief acidic dips downstream. |
Dissolved O₂ (mg/L) | 8.4 (mean) range 7.4–9.4 | 4.9 (mean) range 0–9.7 | Frequent oxygen drops downstream below the sewage outfall. |
Turbidity (NTU) | 21 (mean) median 7 peaks >1300 | 18 (mean) median 10 peaks >1300 | Short-lived spikes after rainfall or local disturbance. |
Conductivity (µS/cm) | ≈649 (mean) range 320–887 | ≈658 (mean) range 4–886 | Consistently high ionic load; similar both sides of the outfall. |
Total Suspended Solids (mg/L) | 34 (mean) median 12 max 1989 | 30 (mean) median 16 max 2066 | Large short bursts coinciding with turbidity spikes. |
Pattern before our October test weekend
In the two weeks leading to 27–28 October, conductivity stayed high (~680 µS/cm) while dissolved oxygen at the downstream sensor showed several sharp lows (< 4 mg/L), coinciding with stable dry weather.
Immediately after the late-October rainfall, both sensors recorded rising oxygen and falling conductivity, reflecting dilution and re-aeration — exactly reflecting the trend seen in our citizen-science test results.
pH and temperature were steady through the month, with only small diurnal fluctuations.
Turbidity peaks correspond with isolated storm events, suggesting local sediment pulses rather than continuous inputs.
Take-away
The live AquaWatch data confirm what our volunteers detect monthly: low-flow periods concentrate pollutants and markedly depress oxygen downstream of the Pixham sewage qorks outfall, while rainfall restores more favourable conditions. These new sensors kindly on loan from AquaWatch are giving us a powerful lens on short-term water-quality changes — a major step forward for the Mole catchment project.
Overall October status
Across the catchment water quality in the River Mole improved from Poor to Moderate status in October. Phosphate and nitrate concentrations roughly halved with the first real rainfall in weeks. Ammonia concentration remains more patchy with some spikes remaining across the catchment, but the overall picture is one of improvement rather than deterioration.

After nearly 1000 tests the majority of the catchment remains Moderate-Poor-Bad water quality.


Our league table of worst-performing streams shows Leigh Brook and Redhill Brook amongst the most polluted in the catchment with regard to our nutrient tests.

Next steps
We’ll dig into seasonal trends in our Autumn 2025 review to be published in January. As always, a huge thanks to every one of our River Mole River Watch citizen science volunteers — your samples, photos and dedication are what make these insights possible.
Water quality classification thresholds used
Status (WFD) | Phosphate (mg/L) | Nitrate (mg/L) | Ammonia (mg/L) |
High | ≤ 0.10 | ≤ 1.50 | ≤ 0.30 |
Good | > 0.10 – 0.20 | > 1.50 – 2.99 | > 0.30 – 0.60 |
Moderate | > 0.20 – 0.50 | > 2.99 – 7.50 | > 0.60 – 1.10 |
Poor | > 0.50 – 2.50 | > 7.50 – 12.50 | > 1.10 – 2.50 |
Bad | ≥ 2.50 | ≥ 12.50 | ≥ 2.50 |
(Locally adapted from the Water Framework Directive thresholds for nutrient status in small lowland rivers.)


Comments