
January 2026 water quality update: Thames Water storm overflows caught in the act!
- Jan 31
- 7 min read
Updated: Feb 1

Our fantastic team of citizen science volunteers were out again monitoring the health of every river and stream in the Mole catchment on 24-25 January following flooding which peaked on 22 January. Their tests revealed something genuinely new in our water quality data. Despite very high river levels and the dilution that usually comes with them, we recorded unusually high ammonia and phosphate concentrations, particularly in small tributaries downstream of Thames Water sewage treatment works.
This update explains what was found, why it matters, and why the timing of our testing was crucial.


Why January was different
January was the third wettest on record in Surrey. With over 170mm, the Mole catchment had nearly double the typical rain for January. This caused sustained high river flows across the catchment particularly on three notable occasions which caused flood alerts and warnings at Pixham and Leatherhead.

Prior to our monthly testing, river levels peaked on 22 January and remained high through the test weekend of 24-25 January.


Storm overflow activity from Thames Water’s sewage network was also extremely high. While the total duration of storm overflows by the time of testing was similar to January 2025, the key difference was how, on this occasion, a long, catchment-wide overflow event involving almost every storm overflow, coincided with our testing on 24-25 January.

There were around 1000 hours of monitored storm overflow discharged in the three days leading up to and during our test weekend. Several storm overflows from the largest STWs started on 20 January after only 10mm of rainfall, this included Leatherhead and Ironsbottom storm overflows which triggered around 22:00hrs after only around 5-6mm of rain and they both continued overflowing non-stop into the start of February..over 270 hours later! Interestingly, Dorking EDM triggered somewhat later at 11:45hrs in the morning of 21 January after 18mm of rain, similar to the major STW at Crawley and Esher. The later trigger time at Dorking could indicate that the newly installed storm tanks are functioning as intended to decrease overflows. Unfortunately, the overall duration of overflows remains comparable to treatment works that haven't been upgraded. This highlights the limitations of storm tanks, as they don't improve the treatment capacity of the works, they only delay the onset of overflows by a matter of hours.

Whilst a wet month, none of the rainfall events through January were "extreme". The largest rainfall accumulation was ~35mm over 48 hours on 20-22 January which is less than a 2-year return period (FEH22 catchment model). This means even the biggest rainfall event preceding our test was by no means "exceptional". In this respect the long duration of storm overflows across the catchment show a failure of Thames Water to work towards the Storm Overflow Reduction Plan target...which requires overflows only operate in exceptional rainfall.
In January 2025, the immediate pre-test sewage overflow activity was much lower, only around 98 hours. Hence, this January presents a unique set of circumstances with a huge input of sewage immediately prior and through our test period.

The timing of this January testing following such a large outpouring of raw sewage into the River Mole from every major sewage treatment works meant the volume of untreated effluent entering water courses was extremely large and built up over several days prior to testing.

It should be noted that these are monitored storm overflows. There are numerous examples around the catchment of unmonitored sewer overflows where sewage runs out of manholes across car parks, roads or fields. These are frequently unscreened and therefore contain rag such as wet wipes and worse. They constitute a potential public health hazard.

This photo depicts the main sewer leading to Pixham spilling raw sewage from a manhole into the Mole near Brockham. This illegal and unmonitored discharge of untreated sewage has been acknowledged by both Thames Water and the EA. A local group of stakeholders, along with RMRW, is working to ensure this issue is resolved.
Perhaps surprisingly, over three years of monthly river monitoring it is the first time our citizen science testing has coincided with the end of such a prolonged, catchment-wide storm overflow event, effectively capturing the impact as it was happening.
Our January tests caught the impact of raw sewage overflowing into the River Mole.
Ammonia: unusually strong signals in specific tributaries

Ammonia showed the most striking change this month. Compared with January 2025, ammonia increased sharply only in streams with sewage treatment works upstream.

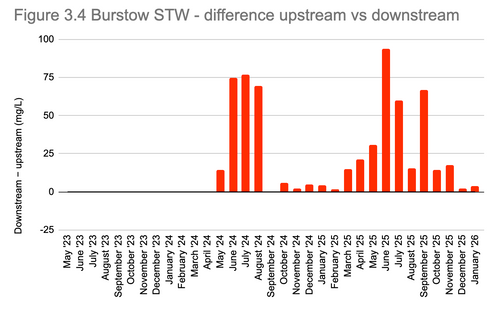
The largest spikes were recorded in Earlswood Brook (3ppm), downstream of Earlswood (Reigate) STW, with further elevated results in Redhill Brook and Salfords Stream, downstream of Merstham STW. Burstow Stream, downstream of Burstow STW, showed a smaller increase.
However, not all sewage treatment works showed this pattern.

Interestingly, Leigh Brook, 7 km downstream of Holmwood STW, did not show an ammonia spike, despite some 100 hours of storm overflows discharging from Holmwood sewage works before and during the test period. Distance downstream appears to be an important factor: the Earlswood Brook test site is just 1.5 km below its STW, while Redhill Brook is about 4 km downstream of Merstham STW but we cannot discount other factors playing a role in the difference.. including internal treatment processes.
Phosphate: reinforcing the picture

Phosphate results reinforce the ammonia findings with several sites increasing over December. The highest phosphate concentrations were recorded in streams hosting sewage treatment works or private treatment plants. Overall, the catchment continues to fall into Moderate water quality despite the dilution.

The worst phosphate levels were found in Earlswood Brook, Hookwood Common Brook, Redhill Brook and Leigh Brook, all well into the Poor water quality class. Earlswood Brook reached 1.87 mg/L, the highest value recorded at this site since February 2024 and an increase over December's result despite much more dilution. Hookwood Common Brook continues to be a concern due to high phosphate loads following a summer of extreme ammonia contamination. Concentrations well above 1 mg/L are highly unusual during high flows, when dilution should dominate, and are strongly suggestive of storm overflow impacts.

Lower Mole sites including Fetcham Splash and Cobham Downside Bridge, also had elevated phosphate readings which were notably above those in the main channel of the River Mole upstream. This is despite very high flows and therefore much dilution. Cobham lies downstream of Leatherhead STW and intermediate pumping stations. In December we recorded very high E. coli (26,000 cfu / 100 ml) here following prolonged storm overflow activity, providing important context for sewage impacts at this location.
Long term average phosphate levels clearly show how the presence of sewage treatment works outfalls is a key control of phosphate.

E. coli: implications beyond river ecology

Our E. coli spot tests show that these storm overflow events are not just affecting river chemistry and wildlife, but also pose potential risks to people using the river environment.
Results of 3,000 cfu / 100 ml at Sidlow Bridge and 6,000 cfu / 100 ml in Redhill Brook both downstream of sewage treatment works, are well above the government guideline of 900 cfu / 100 ml for contact with water. With Cobham testing 26,000 cfu/100ml and Fetcham Splash at 10,000 cfu/100ml the levels of E.coli contamination during storm overflow events indicate high levels of faecal contamination in the river. This has implications for walkers, anglers, dogs, and anyone coming into contact with floodwater, including vehicles driving through flooded roads and potentially spraying contaminated water.
Nitrate: diluted overall, but with notable local signals

Nitrate concentrations overall were lower than January 2025, consistent with strong dilution from very high river flows. However, several sites continue to stand out. Tanners Brook, a largely rural stream, recorded elevated nitrate at 13.5mg/L possibly pointing towards diffuse agricultural sources rather than sewage inputs as there were no storm overflows recorded from the two upstream pumping stations.
Deanoak Brook, another stream draining the rural west of the Upper Mole basin, has similar spikes in nitrate to Tanners Brook. These rural streams draining the west side of the catchment need more investigation to ascertain what might be causing the nitrate spikes.

On the main River Mole, Stepping Stones continued to show a marked increase in nitrate compared with upstream of the Dorking Pixham outfall at Castle Mill despite dilution lowering overall levels since September. Downside Bridge at Cobham also recorded elevated nitrate.

Most sewage treatment works in the catchment show significantly higher nitrate concentrations downstream of outfalls as shown below.


These patterns highlight that, unlike ammonia, nitrate reflects longer-term and catchment-wide pressures, and remains a concern through periods of high flow and dilution.
Long term average nitrate shows the unequivocal impact of sewage treatment works on streams in the catchment.

What this all tells us
This does not mean January created a brand new problem. Rather, it shows what happens when exceptionally long-duration storm overflows coincide with our testing. Our contextual data suggest this situation has likely occurred before, but our monthly citizen science sampling has not previously caught it "red handed" at the right moment.
It is fascinating that January 2026 has allowed us to see something of the immediate impact of storm overflows on the River Mole — catching the system in the act. We will continue to analyse our results closely to understand how quickly — or slowly — the river recovers in the months ahead.
Thank you so much for reading our monthly blog post. We are all unpaid volunteers and rely on donations to support our programme of testing. Please support our work by sharing our information and if you can please consider clicking the Donate button on our website.