
🍂 A Tale of Three Autumns: What 2025 Reveals About the River Mole’s Ongoing Vulnerability
- Dec 15, 2025
- 15 min read
Autumn water quality provides a revealing window into the health of the River Mole. As the river transitions from summer low-flow conditions toward winter recharge, the catchment’s sensitivity to rainfall, geology and pollution sources becomes especially apparent. At a glance, November headlines show the river in poor condition despite the dilution effects of higher river levels, a considerable decline in storm overflow duration and evidence of effective phosphate treatment at some sewage treatment works.

This post brings together results from our citizen-science tests across September, October and November 2025, compares them with the previous two autumns, and places them in the wider context of an unusual year that included a dry spring, a wetter-than-average July, and an exceptionally dry September. By examining phosphate, nitrate, ammonia, conductivity and temperature together, we aim to understand what this tells us about the Mole’s ongoing vulnerability to pollution under changing climate and flow conditions. (note I switch between ppm ≈ mg/L sometimes... both show concentration of pollutants)


Briefly, in other exciting news, our data is proving popular and useful to university academics and students. Most recently we have been working with Dr Alex Lipp, an environmental geochemist at UCL Department of Earth Sciences who is using our data with students to model pollution sources in river catchments. We are also delighted to be supporting another student from Reading University who is studying a PhD on the River Mole.
Autumn 2025 in Context
Phosphate
Phosphate continues to be the most reliable test for illustrating overall seasonal changes in nutrient stress within the River Mole catchment. Our phosphate results exhibit the closest correlation with river flow and are often the first metric alerting us to problems in the catchment.

During autumn 2025, phosphate concentrations were unusually high due to low-flow conditions resulting from a lack of rain after early September, with less than 10mm falling after September 12, and no rain in the three days leading up to testing, as illustrated in the chart below.

September was followed by marked improvement with slightly above-average rainfall in October. While November was somewhat drier than average, overall, the three monthly period of Autumn 2025 is considered "mildly-wet" according to UKCEH.

Despite the "mildly-wet" conditions, Autumn 2025 emerges as the poorest of the last three autumns for phosphate and the catchment mean falls well into the Poor water quality category in the Water Framework Directive WFD as shown in the bar chart below.

November Phosphate Concentrations — Some Relief After the September Spike
The November phosphate catchment average (0.51ppm) shows a continuation of the overall reduction in concentrations since the extreme level seen in September. The right side of the chart below shows the fall in the overall catchment average through Autumn 2025.

The improvement coincided with the return of more sustained rainfall and increased river flows, providing more dilution. However, despite the lower average concentration, the number of failing streams falling into Moderate-Poor-Bad water quality categories stayed about the same through all three Autumn months at well over 80% (September 87% October 82% November 88%).


Furthermore, whilst the catchment average phosphate for November fell a little from October, the main channel in the Upper Mole saw a significant increase in concentration from 0.38-0.57 ppm, going from Moderate to Poor water quality from Horley to the Mole Gap. This is seen in the GIS map below with larger proportional circles and darker choropleths downstream of Horley and into the Lower Mole.

In addition, several tributaries in the Upper Mole saw an increase in phosphate concentration from October including Redhill Brook 1.3-1.55 ppm, Gad Brook 0.43-0.73 ppm and Gatwick Stream Horley 0.44-0.94 ppm. Compared with October there were fewer High and Good rated tests in November with only one High WQ test at Burstow Peeks Brook, and three tests achieving Good WQ at Shag Brook, Gatwick Stream Grattons Park and Ifield Brook. All other tests in November were Moderate or Poor. On the other hand, there were no streams in the Bad WQ category, the first time since February this year.
Phosphate Trends — Tracking River Flow and Concentration

Looking across the full time series of our testing, with now well over 4000 tests, phosphate concentrations in the Mole continue to show a strong seasonal signal that closely tracks hydrological conditions. Periods of low flow are consistently associated with rising phosphate concentrations, while rainfall, lower temperature, reduced evaporation and increasing soil moisture and river discharge especially through winter are followed by declines in phosphate concentration.
September 2025 represents an extreme example of this behaviour. Prolonged dry weather in the second half of September led to low river flows at test time especially in the Upper Mole, with clay-dominated sub-catchments with limited groundwater input. Under these conditions, phosphate concentrations rose sharply. The subsequent drop in October and November is consistent with dilution rather than any immediate change in pollutant loading.

Conductivity trends support this interpretation, reinforcing the role of low-flow concentration as a dominant driver of autumn phosphate behaviour in the Mole.
Upper Mole vs Lower Mole — Contrasting Main-Channel Behaviour
The Upper Mole and Lower Mole behave quite differently through the seasons with regard to pollution concentration. The Upper Mole is a large clay drainage basin with many tributaries while the Lower Mole, starting downstream of the Mole Gap, is narrower with few tributaries.

The Autumn average for the Upper and Lower Mole main channel are similar at 0.81 ppm and 0.85 respectively. However, the charts below show the clear difference between the behaviour of the main river channel in the Upper and Lower Mole through the seasons.

In the Upper Mole main channel — including test sites at Gatwick Stream at Horley, West Vale, Sidlow, Castle Mill and the Stepping Stones — phosphate concentrations show the strongest seasonal contrasts and largest range, with pronounced summer peaks during dry conditions. The Upper Mole also demonstrates the most rapid improvements once rainfall returns, as seen by greater range and variability in the chart below.

Further downstream, through the Mole Gap and into the Lower Mole at sites such as Swanworth Bridge, Fetcham Splash, Cobham Bridge, Lower Mole Molesey and the Ember, phosphate concentrations tend to fluctuate less dramatically. However, they tend to remain poorer water quality than the Upper Mole through winter, indicating significant nutrient pressure.

This contrast highlights how the Upper Mole’s geology, land use and hydrology make it particularly vulnerable to low-flow concentration effects, while the more consistent pollution load in the Lower Mole, shown on the right hand side of the charts above and below, might reflect the cumulative pressure from upstream treatment works, septic tanks, road runoff, industry and agriculture.

Autumn Hotspots — Where Phosphate Remains Highest

Autumn hotspot analysis, using mean concentrations for September to November in test years 2023-2025, shows a familiar group of tributaries that consistently record the highest phosphate levels. Larger tributary streams hosting sewage treatment works such as Leigh Brook, Redhill Brook and Salfords Stream feature Poor WQ. The Hot Spots list also features Hookwood Common Brook which remains among the most elevated in the catchment due to discharge from a package treatment plant outfall. However, a surprising entry is Betchworth Brook with an average Autumn concentration of 1.26 ppm. Betchworth Brook is a small rural tributary with a predominantly agricultural catchment. While several of the worst-affected sites are small tributaries with limited dilution capacity, where local inputs have a disproportionately damaging impact on water quality, others are in the main River Mole channel in the Mole Gap such as Stepping Stones and Swanworth Farm.
Tributaries With and Without Sewage Treatment Works
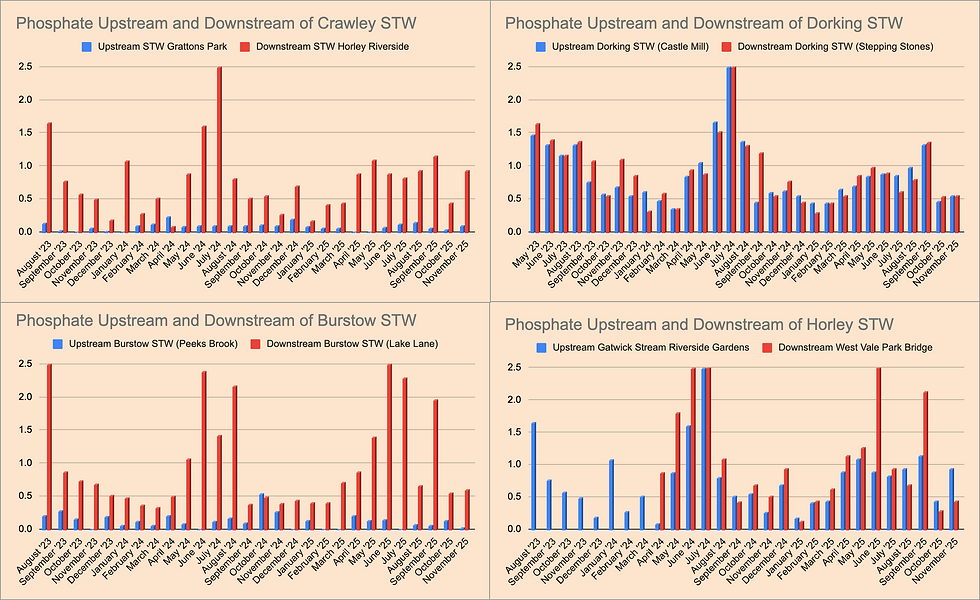
Comparing tributaries with and without large sewage treatment works (STWs) reveals a consistent contrast. Tributaries downstream of the major sewage works at Crawley, Holmwood, Burstow, Horley and Dorking (Pixham) record higher phosphate concentrations than those without discharges from major treatment plants.

Upstream-downstream comparisons, shown below, around the nine major sewage treatment plants show marked increases in phosphate downstream, particularly in the Upper Mole under low-flow conditions when dilution is limited. While diffuse sources and in-stream processes also play a role, the patterns observed are consistent with acute influence from these point-sources of treated effluent and occasional, and reducing, storm overflows.
This reinforces the importance of considering both treatment-works performance and river flow when interpreting phosphate data.
Storm Overflows Show a Reduction
Some welcome news is that total storm overflow duration to November appears to have fallen substantially in 2025 (unless the rest of December goes very wrong!).

Part of the reduction is due to a generally drier year with 711mm of rainfall to November in 2025 compared to 959mm to November in 2024. In addition, the commissioning of new storm storage tanks seem to have helped reduce overflows most markedly at Dorking STW and, to a lesser extent, Burstow.

Our provisional analysis for November 2025 indicates around 409 hours of recorded storm overflows associated with 73 mm of rainfall, compared with approximately 1,400 hours in November 2024, when total rainfall was similar at 79.4 mm.

Looking at the year to date, total recorded spill duration to November 2025 is around 5,400 hours, compared with more than 12,000 hours over the same period in 2024.

This represents at least a 55% reduction in recorded spill duration, although final, verified figures from Thames Water will be needed in the New Year to confirm the full extent of this change. The chart above shows a dramatic fall in storm overflows in March associated with the very dry spring, then a peak in the wet July which received 179% of normal rain for the month. However, of note is the lower storm overflows that appear to have continued through the wetter autumn months. This is welcome news although some of the apparent improvement may be down to key Event Duration Monitors (EDMs), including Horley and others, being offline for extended periods, meaning not all discharges may have been fully recorded. Furthermore, in terms of water quality the lower storm overflows do not seem to have led to an improvement yet.

It is not only large sewage treatment plants and storm overflows that cause problems. We are discovering chronic impacts on water quality from smaller package sewage treatment plants and septic tanks. Hookwood Common Brook continues to stand out as one of the highest and most concerning phosphate and ammonia hotspots in the catchment. Although concentrations improved in late autumn, as the stream refilled with rainwater runoff, pollution levels remain high relative to neighbouring streams — Deanoak Brook, Mans Brook and Spencers Gill — all with similar geology and land use.

This localised behaviour on streams where no one else is testing underscores the value of our citizen-science sampling in identifying problem areas that would otherwise remain hidden. Our investigations in resolving this issue, and many others, are ongoing.
Comparing Autumns 2023, 2024 and 2025
When viewed across the three years, Autumn 2025 emerges as the poorest for phosphate in the River Mole at 0.70 ppm. Autumn 2024 recorded the lowest concentrations overall (0.53 ppm), while Autumn 2024 showed intermediate conditions (0.61 ppm). The extreme low-flow conditions of September 2025 disproportionately influenced the seasonal average, pushing more sites into Poor and Bad WFD classes than in previous years.

This comparison underscores the Mole's vulnerability to extended dry spells and emphasizes the importance of multi-year datasets to start to understand the interplay between climate / weather variability, hydrology, and nutrient pressures. This is further highlighted by the reduction in storm overflow duration this Autumn not appearing to ameliorate the high levels of phosphate concentration.


Our data clearly shows how phosphate treatment practices by Thames Water have a significant impact on water quality, as demonstrated in the chart below showing three similar streams with major sewage works upstream of test sites. In contrast to other streams with upstream sewage works, Earlswood Brook, located downstream of the Earlswood sewage treatment plant in Reigate, has consistently shown a reduction in phosphate levels over the three years as shown by the chart below. This improvement is likely due to modifications in the phosphate treatment dosing. We have inquired with Thames Water about how this success in reducing phosphate concentration can be replicated in other facilities in the Mole catchment.


Bringing these threads together is an ongoing challenge and demands further examination, especially regarding the combined effects of reduced storm overflows this autumn, which hopefully continue, and Thames Water's efforts to lower phosphate at specific treatment facilities. While welcome news, neither of these are mitigating phosphate concentrations in the catchment as yet.
Nitrate — Autumn Patterns, Persistent Hotspots and Downstream Signals
At 17.4 ppm average nitrate concentration in Autumn 2025 was slightly higher than Autumn 2024 (15.7 ppm). This was despite the apparent improvement seen immediately after the September spike. This suggests that while rainfall provides short-term relief, underlying nitrate pressures in the catchment remain unresolved.

Similar to phosphate, nitrate concentration in the Autumn months this year showed an unusual pattern with extremely high levels in September, with levels much higher than in July and August, as shown below.

The chart below illustrates how October rainfall led to widespread dilution following the low-flow period in September. Modest rainfall just before the test weekend was enough for November to maintain generally lower nitrate concentrations as river levels bounced back. There appears to be a strong correlation between the three-day antecedent rainfall and the tested nitrate concentration. A three-day period was selected because it is assumed to encompass the time required for rain to travel to the channel and reach the Thames confluence, thereby passing through each test site.

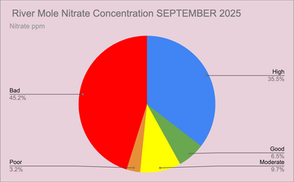
Pie charts depicting the three autumn months of 2025 and the allocation of tests across each WFD water quality category highlight the impact of minimal rainfall on September's results, with over 45% of tests classified in the Bad WQ category for nitrate.


River flow shows a similar seasonal impact on nitrate concentration as phosphate.

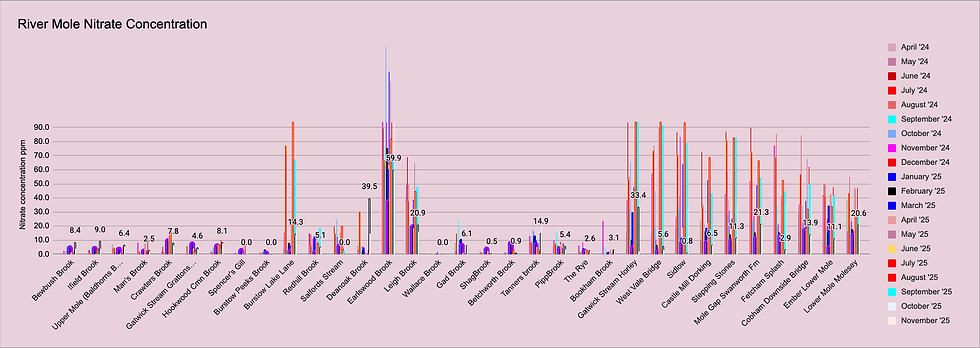
The GIS map below shows the high nitrate concentrations in tributaries with sewage treatment works and along the main-channel reaches of the "Middle-Mole" downstream of Sidlow and Dorking into the Mole Gap and Lower Mole. Most tributaries show lower levels of nitrate but with notable exceptions.
Nitrate Hotspots and Downstream Changes

It is the tributary streams which host sewage treatment works that continue to stand out as nitrate hotspots. Earlswood Brook recorded a marked increase in November (93.8 ppm) compared with October (59.9 ppm) and remains consistently among the highest nitrate concentrations observed in the catchment. Burstow Stream and Gatwick Stream Horley also continue to feature among the most elevated sites, both test sites being located downstream of major STWs.

The impact of treated sewage on nitrate is particularly strong downstream of Crawley, Burstow, Horley and Dorking (Pixham) sewage treatment works, and persists across a range of flow conditions as shown by the charts below.

Deanoak Brook and Tanners Brook exhibit unusually high nitrate levels in October and November, despite being rural clay catchments without large sewage treatment facilities. Investigations will focus on pumping stations, septic tanks, and agricultural runoff.
Nitrate concentrations in the main river downstream of Dorking increased at most sites in November. While monthly values fluctuate, the average downstream signal shown below remains clear, indicating nitrate accumulation in the main channel. This contrasts with ammonia, which shows localized spikes and a decline downstream.

The bar charts above and below illustrate low nitrate levels in most tributaries, except those near sewage works like Burstow Stream, Leigh Brook, and Earlswood Brook. Elevated nitrate levels persist along the main River Mole channel from Horley to Molesey. This high nitrate load passes through the vulnerable chalk Mole Gap, where river water can seep into the groundwater, potentially contaminating the aquifer that supplies over 80% of local drinking water. We are testing nitrate levels in the Mole for SESW as part of a two-year investigation into elevated groundwater nitrate, aiming to understand how nitrate enters the aquifer.
Ammonia — Mostly Low Background, with a Few Persistent Outliers
Ammonia is the nutrient in our dataset most associated with acute sewage inputs. Monthly ammonia results have been a helpful prompt for us to further investigate sub-catchments such as Hookwood Common Brook and Wallace Brook.


In contrast to phosphate and nitrate (which show distinct catchment-wide patterns), ammonia in the Mole is generally low at most sites most of the time, with a small number of streams driving the highest readings. Ammonia levels decay strongly downstream.
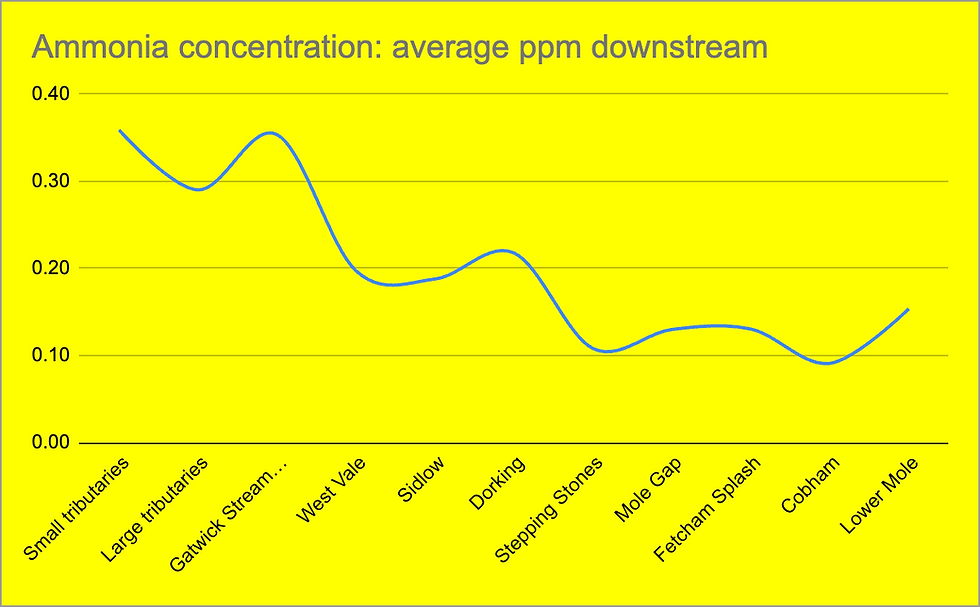
Ammonia behaves differently from phosphate and nitrate because it is short-lived in rivers. As water flows downstream it becomes better mixed and more oxygenated, allowing natural bacteria to rapidly convert ammonia into nitrate (a process called nitrification). At the same time, increasing river flow dilutes concentrations, and aquatic plants and microbes take up ammonia as a nitrogen source. As a result, ammonia spikes tend to be localised and short-lived, often spiking close to pollution sources and diminishing downstream even where other nutrients remain elevated.
November 2025 Ammonia — Lower Overall, with Localised Spikes

The catchment mean ammonia in November 2025 was 0.12 mg/L, down from 0.21 mg/L in October and 0.34 mg/L in September. The median remained 0.10 mg/L in all three autumn months indicating that typical conditions across most sampling sites were consistently low, even while a few outliers remained shown in the chart below.

This "low average with occasional spikes" pattern indicates that ammonia levels are influenced by localized, acute episodic events rather than consistent, widespread processes across the catchment. This is further evidenced by the weaker correlation with river discharge displayed below.

Which Sites Spiked in Ammonia During November?

Ammonia hotspots are not the same as phosphate/nitrate hotspots. There are a number of sites that rate highest in ammonia but do not always feature high concentrations of other nutrients.


Wallace Brook is the standout outlier in November at 0.95 mg/L, a substantial improvement from 1.40 mg/L in October, but still elevated relative to the wider catchment and a contiuation of elevated ammonia we have seen in this brook for the entire data series.
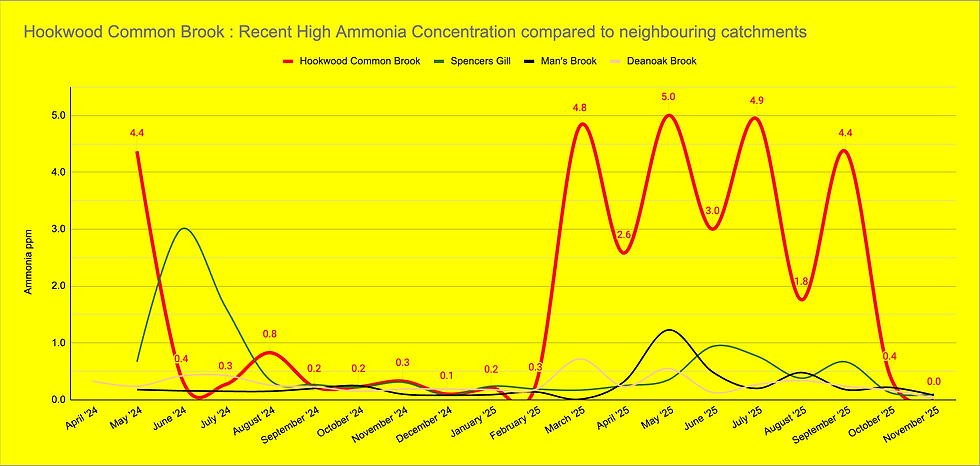
Hookwood Common Brook had by far the highest ammonia test results through summer and into September and October but has dropped away dramatically in November to 0 ppm.
Leigh Brook featured sporadic spikes in ammonia in August (3 mg/L) and October (0.63 mg/L) but was not an issue in November (0.05 mg/L).
Salfords Stream increased from 0.24 mg/L (Oct) → 0.49 mg/L (Nov), remaining below Moderate–Poor boundaries but worth noting as an upward move.
Betchworth Brook rose from 0.08 mg/L (Oct) → 0.34 mg/L (Nov), moving into the “Good” band under locally adapted thresholds (0.30–0.60 mg/L). There has been a noticeable uptick in ammonia in this brook through autumn.
What This Suggests — and What It Doesn’t

What the data robustly support:
Ammonia across the Mole in autumn is generally low as supported by the stable median of 0.10 mg/L and the reduced mean of 0.12 mg/L in November.
A small number of sites can still show significant spikes away from their long term average (e.g., Wallace Brook at 0.94 mg/L), which can disproportionately influence the catchment mean.
We cannot, from spot sampling alone, assign each spike to a specific source or event timing with certainty. However, the pattern is consistent with local inputs that are likely to be more visible under low flow conditions and, should they continue, will prompt further investigation into the causes.
Ammonia Summary
Autumn 2025 ammonia results reinforce a clear message: the Mole’s ammonia problem is not catchment-wide, but it is localised. Most sites in November were in the High/Good range, while a small number of brooks continued to show elevated readings that merit ongoing attention—particularly where they coincide with other nutrient pressures or where repeated spikes occur. Ammonia is a useful red flag to indicate possible problems, or perhaps that should be a yellow flag to be more precise!
Conductivity and Temperature — Setting the Physical Context
Conductivity acts as a broad indicator of how concentrated dissolved substances are in the river. Although not as pronounced as the nutrient pollutants, conductivity responds to changes in flow as shown below by the broadly seasonal peaks and troughs.

During the prolonged dry conditions of early spring, summer and early autumn this year, conductivity rose across much of the catchment, reflecting low dilution and the concentration of existing pollutants. Following rainfall in late October, conductivity fell sharply, mirroring the reductions seen in phosphate and nitrate and reinforcing the role of hydrology in driving water-quality change.

Downstream changes in conductivity, broadly left to right in the chart above, show similar but not identical patterns to nitrate and phosphate. Of note is the very high conductivity in the Rye Brook (Ashtead), pictured below earlier this year.

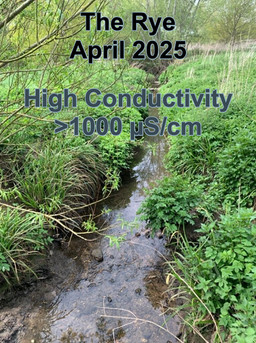


The Rye has the highest conductivity in the catchment as shown in the chart below.

However, the Rye does not feature elevated nutrient loads. It is known that the Rye suffers from misconnections upstream which SERT are endeavouring to resolve through naturalising the river and hopefully adding reed beds. It is likely the non-sewage related provenance of this pollution that may explain these unusually high conductivity readings with low nutrient load, unique in the catchment.

Water temperature followed a more predictable seasonal pattern, declining steadily from September into November. It is notable that June saw the peak in water temperature this summer following the dry and warm spring. A wet July suppressed the usual summer heat.

The seasonal cooling through Autumn improves oxygen availability and slows biological processes, helping to ease ecological stress after summer low-flow conditions. Taken together, conductivity and temperature help explain why nutrient concentrations peak during dry, warm periods and then decline as flows increase and waters cool. Autumn 2025 clearly illustrates how these physical drivers can temporarily relieve pollution pressure without resolving the underlying sources.
Autumn 2025 in Perspective
In conclusion, the River Mole remains in poor condition and Autumn 2025 stands out as the poorest of the last three autumns for water quality with most sites still failing WFD-based nutrient thresholds.
This was driven largely by the exceptionally dry conditions in September that led to widespread nutrient concentration. This poor outcome is despite the reductions in storm overflow duration and evidence of improved phosphate dosing at some Thames Water plants. The green bars in the chart below show how September 2025 caused spikes in phosphate at numerous test sites compared with previous years.

Although rainfall in late September and October brought short-term improvement, it was not enough to offset the impact of early-autumn low flows, particularly for phosphate and nitrate. Comparisons with Autumns 2023 and 2024 highlight how strongly the Mole responds to the timing of rainfall in a few days rather than total monthly rainfall alone. Furthermore, the reduction in storm overflows and improvements in phosphate reduction at certain plants does not appear to have had a material impact on water quality as yet.
Taken together, the results reinforce the Mole’s vulnerability to prolonged dry spells and the importance of continued, long-term monitoring to shed further light on these complex interactions.
Thank you SO MUCH for reading this post... all our fabulous citizen scientists and the trustees are all unpaid volunteers doing this to improve the river for wildlife and people. If you would like to support us then please LIKE and share this post (hit the heart button on this page) and also please consider clicking the Donate button somewhere on this page if you can support us further. Thank you :-)


Comments