
December 2025 Water Quality: Floods, Sewage, and Emerging Patterns in the Mole
- Jan 7
- 9 min read
Happy New Year and Happy New Charts!

December’s River Mole River Watch water quality monitoring took place in unusually high flow conditions after a storm dropped over 35mm of rain a few days prior to the test weekend. The rain triggered widespread storm overflows across the Thames Water assets in the catchment, resulting in prolonged discharges of untreated sewage which was transported downstream. Data from December tests can potentially show how the river responds to recent sewage spills. (*Featured drone picture of flooding at Swanworth Fm with thanks to Stephen Walker)

December also marks an important milestone for River Mole River Watch: this month’s results are the first to be analysed using a new generation of charts designed by us to better understand long-term patterns, seasonal behaviour, and spatial contrasts across the catchment. In this post we showcase a selection of our new charts.
As ever, our findings are grounded in our citizen science data. Every result discussed below comes from our dedicated and trained volunteers who go out month after month, in all conditions, to collect samples across the Mole and its tributaries.


The consistency of this effort and high quality of sampling and testing is what allows unusual patterns to be identified — and questioned — with confidence. As always we send a huge thank you to all our testers.
At a glance — December in context


At a catchment scale, with 33.3% of tests in Poor/Bad status, December 2025 shows a modest improvement compared to November which saw over 45% of water courses in the worst condition.

As expected due to the dilution from high river flow, average phosphate concentrations continue to fall month-on-month since the extraordinary spike in September.

Nitrate levels were also lower than both November 2025 and December 2024. However, these headline figures mask strong spatial contrasts within the river system, particularly along the main channel.
Hydrological backdrop — floods and overflows

River discharge during the December sampling period was high, due to the widespread rainfall across the catchment on the 18th December.

Thames Water EDM data shows prolonged storm overflows were triggered by the rainfall on the 18 December. Several continued to discharge untreated sewage well into the sampling weekend. A total of over 600 hours of storm overflows were caused by this rain event.

The spate flow conditions and exceptionally high storm overflow duration in the days leading up to testing frame everything that follows and are essential context for interpreting the data.

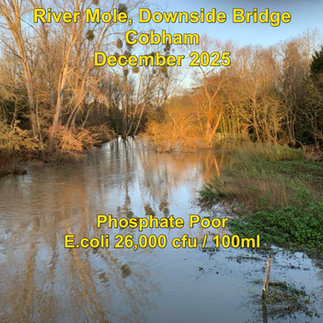
One notable result of the long duration of untreated sewage outfalls was high E.coli as testd at two sample sites. Over 26,000 cfu/100ml was recorded at Cobham and 12,000 cfu/100ml at Sidlow Bridge. These high levels may be associated with the storm overflows and release of untreated sewage into the river, although other sources cannot be ruled out.


High flows matter because whilst they cause dilution of pollution concentration they also mobilise and transport higher pollution loads downstream. This means that, while they can lower concentrations at some sites they can simultaneously increase pollutant loads. For this reason, we distinguish carefully between concentration mg/L and load kg/h.

Phosphate — an unusual contrast
Phosphate shows the most striking and unusual pattern this month both in terms of trends over time and catchment geography.

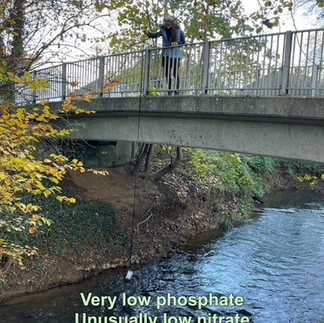
As expected due to dilution, along the upper main channel, from Gatwick Stream Horley through West Vale, Sidlow, Castle Mill Dorking and Stepping Stones, phosphate concentrations were very low. Indeed, the average for this group was only 0.33 mg/L which is the second lowest for this stretch of main channel over the entire data series.

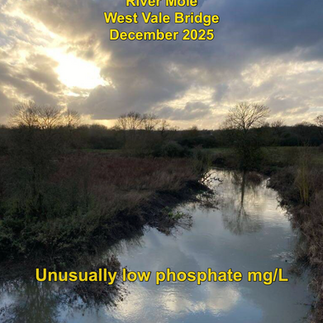


All five sites recorded values in the Moderate water quality range, with Gatwick Stream Horley even returning a Good classification — a rare occurrence for this site which has only achieved Good status on one other occasion in April 2024 as shown in the chart below.

However, in sharp contrast, the Lower Mole main channel, beginning immediately downstream at Mole Gap Swanworth Farm and continuing through Fetcham, Cobham Downside Bridge, Ember Lower Mole and Lower Mole Molesey, recorded a significant uptick in phosphate, averaging 0.82mg/L which is firmly into Poor status. Furthermore, the step-change between the Stepping Stones (0.46 mg/L) and Mole Gap Swanworth Farm (0.91 mg/L), with no intervening STW outfalls, is particularly striking and not easy to explain from diffuse runoff.


Averaged across sites, the upstream main channel recorded 0.33 mg/L, while the downstream main channel averaged 0.82 mg/L — the largest separation between these two reaches observed in the entire >30-month monitoring record.


Most tributaries showed relatively low phosphate in December, with notable exceptions being streams hosting sewage treatment works upstream of the monitoring sites. Leigh Brook, Redhill Brook, Salfords Stream and Earlswood Brook all remained firmly Poor, continuing long-established patterns of streams with sewage treatment works characterised by the worst water quality.


On the other hand, Burstow Lake Lane, despite hosting a STW, recorded a Moderate result at the upper end of that category, while Hookwood Common Brook again recorded elevated phosphate likely linked to the package treatment plant upstream.
This spatial contrast — low phosphate dominating the upper main channel and many tributaries, but high phosphate persisting downstream of the Mole Gap — is unusual for December and stands out in the long-term record.
Nitrate — almost the inverse of phosphate
Like phosphate, average nitrate was also much lower in December but behaved differently to phosphate.

December’s catchment-average nitrate concentration was lower than November 2025 and lower than December 2024, making it the second-lowest monthly average in our dataset (which extends back to April 2024). The number of sites classified as Bad fell sharply compared to November, from twelve to just five.

The main outlier remains Earlswood Brook, which at 25.6 mg/L, again recorded the highest nitrate concentration. Tanners Brook also recorded nearly as Bad result despite having no STW upstream (although upstream Tanners / Bents Brook does host Spooks Hill pumping station), possibly highlighting the role of land use and diffuse inputs in some parts of the catchment. Tanners Brook has a history of elevated nitrate during winter periods as shown by the blue line in the chart below. The selected group of streams in this chart, all drain the rural agricultural west side of the upper catchment. They include streams which show similar nitrate spikes e.g Pipp Brook and Deanoak. This suggests an agricultural origin. The sustained nature of the Tanners Brook nitrate surge was notable last winter from September through to January. Let's see if a similar trend occurs this winter.

Unlike phosphate, nitrate concentrations along the main channel decreased downstream, markedly declining through the Mole Gap north of Dorking into the Lower Mole. The Upper Mole at West Vale, Sidlow Bridge and Castle Mill were the only main-channel sites to record Bad status nitrate levels. This pattern is almost the reverse of what we observe for phosphate.

While STW-influenced sites showed higher nitrate on average than non-STW sites in December, the contrast was the lowest recorded, and several STW sites recorded unusually low nitrate concentrations such as Burstow Lake Lane.
Ammonia — mostly low, with localised anomalies

Ammonia concentrations were generally low across the catchment in December, as expected under winter conditions. Most sites recorded values close to zero.
A small number of sites stood out. Wallace Brook returned to the highest ammonia concentration this month (0.9 mg/L), while Hookwood Common Brook — which dominated ammonia readings through the summer — tested zero ppm for the second month (note: the map above continues to show a yellow dot for locational purposes but I'll adjust this in the next version!).
More unusual were moderate ammonia readings across several Mole Gap sites, including Mole Gap Swanworth Farm, Fetcham Splash and Cobham Downside Bridge. These are shown as the yellow shaded catchments in the Lower Mole. Usually there is a strong decline in ammonia downstream so this rise in ammonia downstream, albeit modest, is another anomalous trend for December. Could it be a result of 600 hours of sewage discharge?

This Lower Mole reach simultaneously recorded lower than usual nitrate, a combination that raises interesting questions about in-river processing and source timing. Our data - and my chemistry - do not yet allow firm conclusions about causes here, so this pattern warrants further investigation and some questions to my more qualified trustees in this field.
Loads, discharge and storm overflows — correlation, not causation
Using catchment-average concentrations and river discharge at Leatherhead as a proxy, we can estimate catchment nutrient loads for phosphate, nitrate and ammonia. Unsurprisingly, all three loads correlate strongly with discharge: high flows move more material through the system.
Storm overflow duration also correlates with load, but this relationship must be interpreted with care. Load calculations are inherently discharge-driven, and discharge itself is linked to rainfall that triggers storm overflows. As such, these are all so interconnected that we cannot yet isolate EDM activity as a direct causal driver of nutrient loads. A work in progress!

What the data do show, consistently, is that streams hosting STWs remain over-represented among the Poorest phosphate sites, regardless of flow conditions or season. Nitrate displays this even more clearly.


At the catchment scale, conductivity shows less relationship with the presence of STWs or EDM activity. However, high conductivity seems to be strongly associated with low flows.

Conductivity may also be sensitive to local misconnections as illustrated by the Rye Brook which consistently records the highest conductivity and is known to suffer from misconnections upstream.

What stands out in December
December 2025 highlights why long-term, catchment-wide monitoring matters. The unusually low phosphate across the upper main channel, the sharp step-change downstream of the Mole Gap, the near-inverse behaviour of nitrate, and the localised ammonia anomalies would be difficult to identify without consistent spatial coverage and historical context. This evidence helps us to lever action by highlighting problem streams and working with partners such as local councils, SERT, the EA, Thames Water and Gatwick Airport as well as anglers and farmers and other land owners to seek improvements.
A quick word on sewage works
We have several sites that are located immediately up or downstream of a number of the major sewage works in the Mole catchment. Comparing the differences in water quality between the sites upstream and downstream of sewage outfalls helps to highlight the complex relationship between the input of sewage, both treated and untreated, into our rivers and water quality.


The test sites for Crawley and Burstow STWs are on smaller tributaries which seem to show the largest difference downstream of these outfalls. The Horley and Dorking sewage works discharge effluent into the larger main River Mole and so the discharging effluent appears to have more variable impact on water quality downstream. The impact on nitrate concentration for the same sites is a similar story with Burstow and Crawley STWs having the biggest impact on water quality downstream.


The data suggest many factors are involved with determining the impact of sewage outfalls from individual treatment works... not least the treatment available, the quality of operation and the volume and type of permitting of effluent.
Nevertheless, for the catchment as a whole the impact of sewage treatment works is clear... streams which host sewage treatment works have levels of phosphate concentration 2 - 3 times more than those without.

Furthermore, in all rank orders the streams with sewage treatment works dominate those featuring the worst water quality, shown below by nitrate concentration.

It is also clear that the impact of sewage treatment works on water quality spans all seasons but the impact is on average worse in summer at low flow.
There are various upgrade works being carried out on some of the larger works in the River Mole catchment. Several of these upgrades are focussed on building larger storm tanks to reduce the frequency sewage spills during rain events. An example of new storm tank is shown below in Dorking (photo courtesy Stephen Walker).

With 807 mm of total rainfall in the Mole catchment, 2025 was around the average for our catchment. Consequently, it was no surprise that the duration of storm overflows decreased to levels similar to those in 2022, which experienced comparable rainfall.

This reduction in storm overflows was expected due to lower rainfall. Nevertheless, total duration of sewage spills is still unacceptably high in the major sewage works and still occur well below "extreme" rainfall events. In addition, several totals are likely reduced due to offline periods during engineering works. In short, the vulnerability of sewage works to readily spill after modest rainfall is likely to continue. Whether Thames Water is on track to fulfil the Government's targets in the Storm Overflow reduction plan is a question we need to put to them.
Storm Overflow Reduction Plan target: By 2050
No storm overflow in England, regardless of location, should cause local adverse ecological impacts.
No overflow should discharge above an average of 10 times per year (over a 10-year period) outside of unusually heavy rainfall.

Of concern is the strong rise in duration of storm overflows from CSOs and pumping stations despite the recent lower rainfall.

These smaller EDMs are often measuring outfalls that discharge into vulnerable small streams where the impact of even modest effluent volumes can be devastating as we measured this year in Hookwood Common Brook where a single private package sewage treatment plant essentially "killed" the brook with high ammonia and phosphate concentration in the summer as natural flow in the stream declined.

We continue to identify problem streams in the catchment and work with partners to improve water quality.
A huge thank you
None of this work would be possible without our citizen science volunteers. Month after month, they go out to their river site to collect samples across the catchment — sometimes in difficult conditions — providing the foundation for everything we report here which provides evidence to target improvements where they can be most effective. The commitment of our citizen scientists is the backbone of River Mole River Watch, and we are deeply grateful for it. Thank you so much everyone and thank you reader for finishing this post. Please hit the LIKE button and share this with everyone you think will be interested.


Comments