
When April doesn't shower: what super-dry weather reveals about the River Mole
- 2 days ago
- 11 min read
Updated: 13 hours ago

April was an exceptionally dry month across the River Mole catchment. With only around 5 mm of rain recorded before testing, river levels fell and pollution concentration strengthened.
This month’s citizen science results show what often happens as the catchment moves from winter into spring: nutrient concentrations begin to rise, some streams remain in good condition, while others, including those shown below, showed a significant increase in pollution pressure.


Fortunately, there did not seem to be any acute pollution events in April. In fact, due to the extremely dry month, there were no recorded storm overflow discharges into the River Mole or its tributaries in April.
Nonetheless, our data shows that low river flows reveal persistent underlying pressures already present in the river catchment.
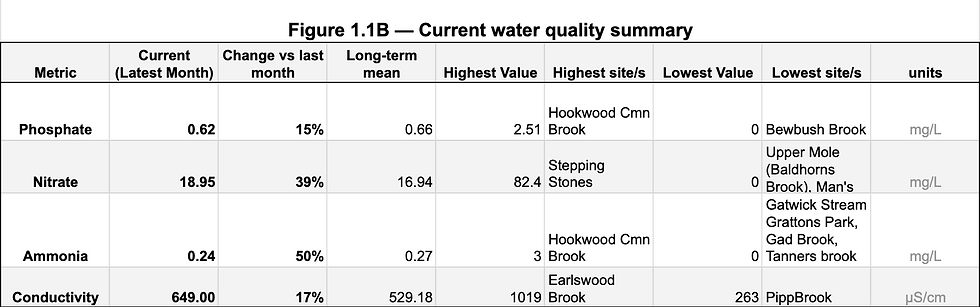
Phosphate levels remain high in several tributaries, nitrate has increased significantly in parts of the Upper Mole, ammonia is generally low but with notable local spikes, and conductivity has risen as rainfall and river flow have decreased.

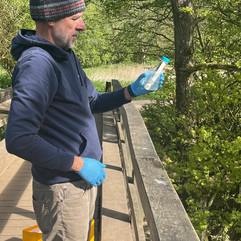

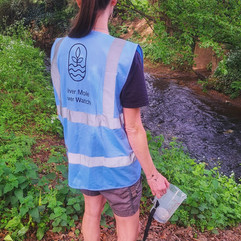


As always, a huge thank you, to our brilliant team of citizen scientists for collecting another full month of data across the whole River Mole catchment.
April context: a super-dry month after a wet start to the year

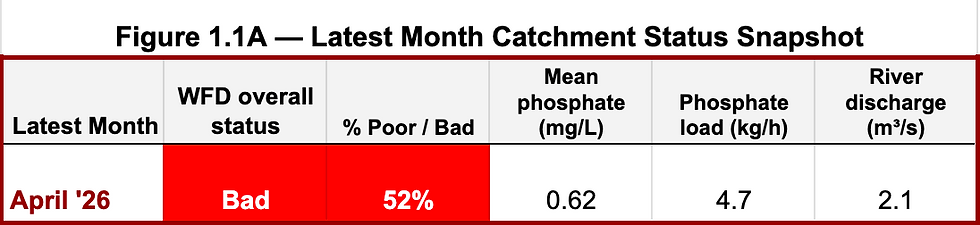
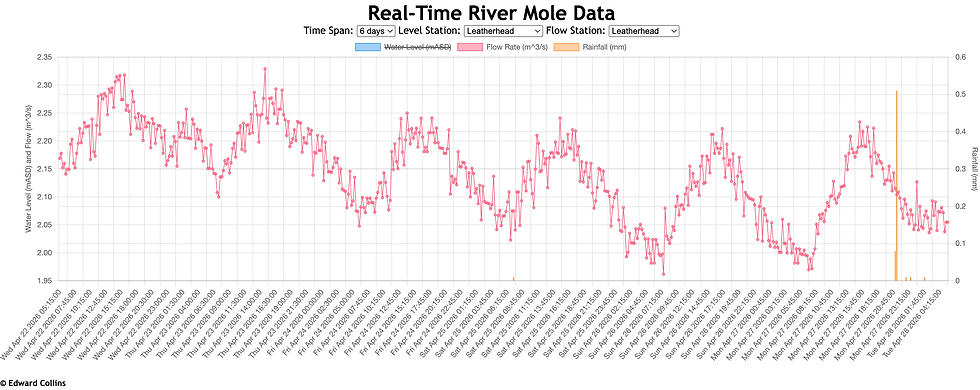
While March was fairly dry (50% of normal rainfall), April 2026 was much drier, with only 5 mm of rainfall recorded before testing which is only 11% of normal rainfall. For comparison, April 2025 was also dry but saw 19.40 mm, while April 2024 was much wetter at 89.20 mm. River flow at Leatherhead was low at 2.10 m³/s, down from 3.20 m³/s in March.
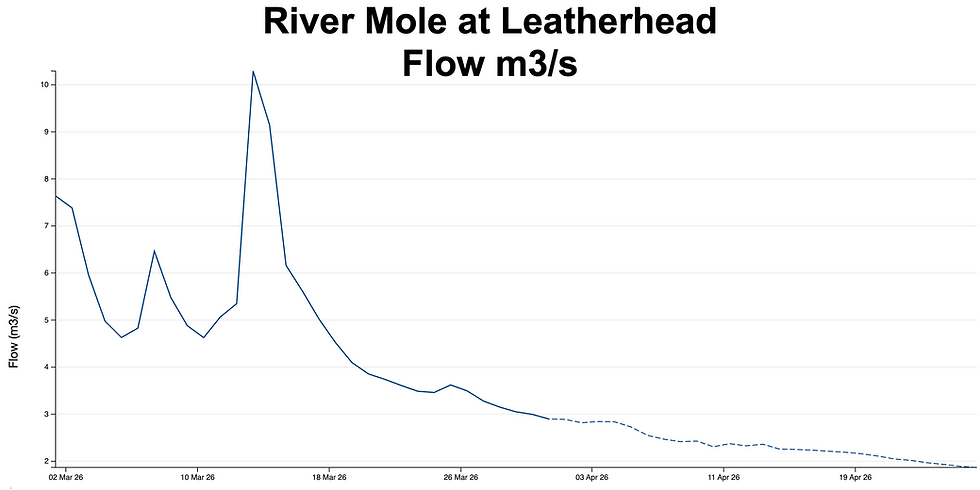
This matters because many water quality results are strongly affected by dilution. When river flows fall, the same amount of pollution can produce a higher concentration in the water. That is why dry spring and summer periods are often when nutrient pressures become most visible.

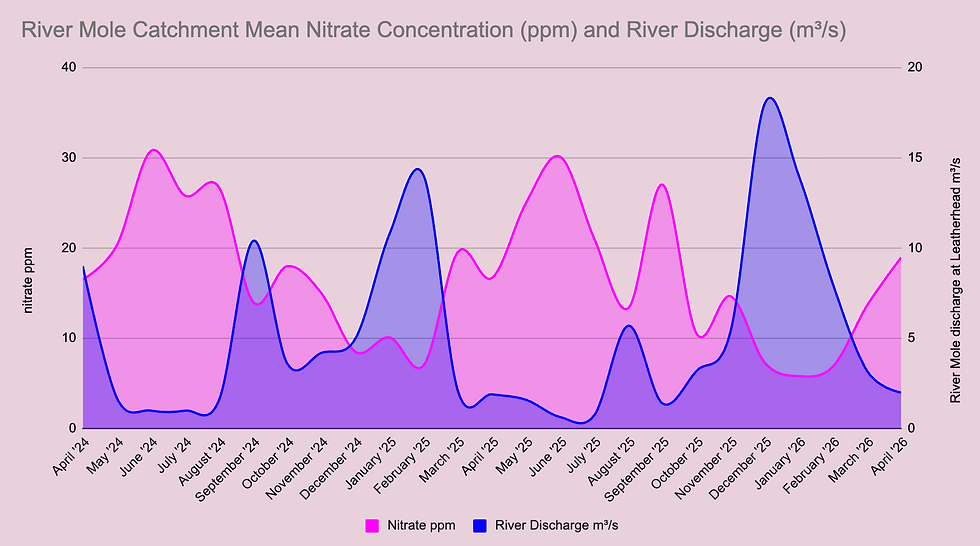
The longer-term phosphate and discharge chart below shows this relationship clearly. Over the past three years, phosphate concentrations have tended to rise when river discharge falls. April 2026 fits this familiar pattern: not an extreme month overall, but one where low-flow conditions allowed concentrations to rise again after the wetter winter period.

One important caveat regarding sewage overflows is the Box Hill EDM. Our April context dataset shows 0 hours of recorded storm overflow discharge to the River Mole or its tributaries.

However, Box Hill EDM recorded around 7 hours of discharge to groundwater on 26 April, after a long dry period with no rain for 10 days. This is separate from the river discharge dataset, but it is noteworthy because the Box Hill overflow discharges into chalk geology connected to an important groundwater system. A dry flow such as this is deemed illegal and we are raising this incident with Thames Water.

Overall picture: a more polarised month
Across the catchment, April pollution concentration results were more polarised than March. The catchment mean phosphate concentration rose from 0.54 mg/L in March to 0.62 mg/L in April. That is slightly lower than April 2025, which averaged 0.68 mg/L, but still firmly in the Poor range overall.
The water quality status chart below shows this well.
April had the highest proportion of Poor/Bad phosphate results so far this year at 55%, up from around a third of sites in March.

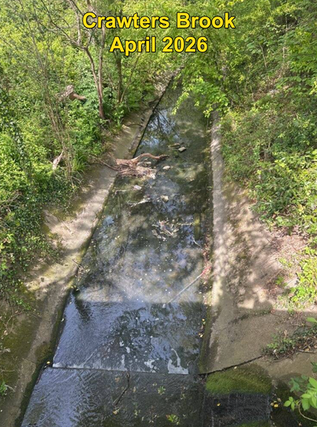
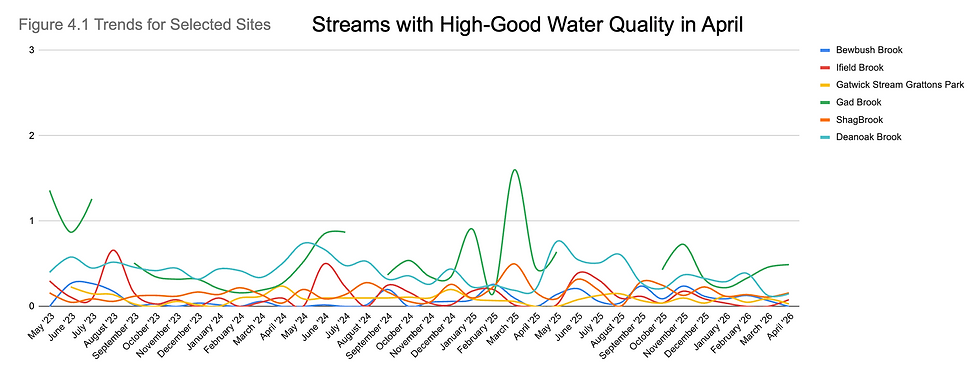
However, April also had a relatively high proportion of High/Good results, showing that deterioration was not evenly spread across the catchment. Some streams such as Bewbush Brook, Ifield Brook and the upper Gatwick Stream remained in Good or even High condition, while others worsened sharply such as Hookwood Common Brook, Man’s Brook, Crawter’s Brook, Betchworth Brook and Bookham Brook all significantly deteriorated in status. Leigh Brook remained Bad at flashing >2.50 mg/L, off the scale of our Low Range Hanna checkers.

This “polarised” pattern is important. It means the catchment average does not tell the whole story. The key question is where concentrations are rising, which streams are repeatedly affected, and whether those changes are linked to low flow, sewage treatment works, private treatment systems, rural runoff, urban runoff, or a mixture of pressures. Our rolling league table of least-most polluted streams give us an important summary of water quality status across the catchment.

Phosphate: dry weather, hotspots and an unusual Earlswood pattern
Phosphate rose modestly across the catchment in April, from 0.54 mg/L to 0.62 mg/L. The overall average was similar to recent Aprils, but the map shows a clear geographic pattern.

Several tributaries deteriorated in water quality status this month. Man’s Brook moved from Moderate to Poor, Crawter’s Brook from High to Poor, Hookwood Common Brook from Moderate to Bad, Betchworth Brook from Moderate to Poor, and Bookham Brook from Moderate to Poor. Meanwhile, Leigh Brook remained Bad, and Salfords Stream and Spencer’s Gill remained Poor.

At the other end of the scale, Gatwick Stream at Grattons Park continued to perform well, remaining High from February through April. Wallace Brook also improved for phosphate this month, moving from Moderate to Good, although it remains important for ammonia, as discussed below.
Two sites stand out most clearly for phosphate. Leigh Brook remained at 2.51 mg/L, the highest concentration our Hanna phosphate checkers can record. Hookwood Common Brook also rose to 2.51 mg/L in April. These two streams have been repeated hotspots in our monitoring and remain among the most phosphate-impacted watercourses in the catchment due to the impact of sewage effluent dominating at low flow.
One of the most interesting continuing observations is Earlswood Brook. Many phosphate-stressed tributaries in the Mole catchment tend to show their highest concentrations in the summer, when rainfall and river flows are low.

Earlswood Brook appears to have behaved differently over the past year with the opposite trends to most sewage-influenced streams in the Mole catchment.
Earlswood Brook has exhibited higher phosphate through winter and early spring, but lower concentrations through parts of last summer and autumn.
This suggests Earlswood Brook may be responding differently from many other tributaries, potentially reflecting the influence of Reigate (Earlswood) sewage treatment works performance and effluent-dominated flow rather than the usual summer concentration pattern alone. This is one we are watching carefully as it is a sub-catchment that is of great interest which we will be coming back to in the future.
One reason this matters is that treated sewage effluent is not necessarily the same all year round. Different pollutants are removed in different ways at sewage treatment works.
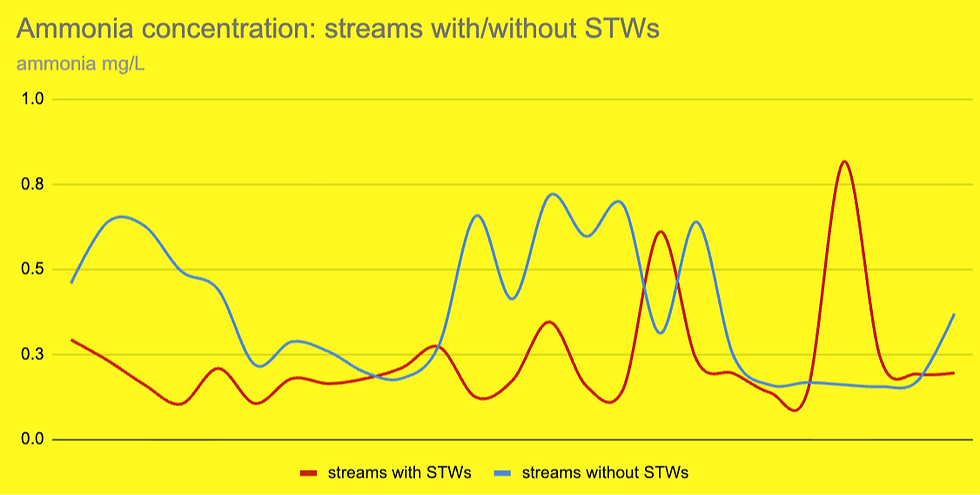
It's worth reminding readers that ammonia concentration in the Mole catchment is usually lower in streams with sewage treatment works than those without. This is because STWs strip ammonia as part of their waste water processing.

Ammonia is mainly reduced by biological treatment, where bacteria convert ammonia into nitrate. This process works less efficiently in colder winter conditions, which can allow more ammonia to pass through the works. This is shown in the chart above with the higher red bar in winter showing increased ammonia concentration in streams influenced by STWs. As temperatures rise in spring, ammonia removal may improve as shown by smaller red bars in summer. However, ammonia is strongly affected by a few local spikes, so these seasonal averages are also influenced by individual sites without major STWs such as Wallace Brook and Hookwood Common Brook.

Nitrate in final effluent increases in summer because more ammonia is being converted into nitrate, as shown in the tall red bars in summer in the chart above. Concentration rises further due to low flow in the drier spring and summer.
Our data shows that nitrate is a major signal of treated-effluent in the catchment.
At many sewage treatment works, phosphate is reduced by chemical dosing, often using iron salts to bind phosphate so it can be settled out and removed. This process is operationally managed and may not follow the same seasonal pattern as ammonia or nitrate. In a small brook like Earlswood Brook where treated effluent forms a large proportion of the flow, changes in treatment performance can therefore show up very clearly in our monthly results.

This may help explain why Earlswood Brook appears to buck the usual seasonal trend. In most streams, low summer flows tend to concentrate pollutants.
In Earlswood Brook, recent winter and early spring peaks suggest the brook may also be reflecting how the sewage treatment works is operating during colder, wetter periods. More operational data would be needed to confirm this, but the pattern is important and will remain a focus of our monitoring.

Streams with sewage treatment works continued to have higher phosphate on average than those without, but the gap was smaller than usual this month. In April, streams with sewage treatment works averaged 0.78 mg/L, while streams without averaged 0.52 mg/L. That difference is still meaningful, but low flows appear to have raised concentrations more widely across the catchment.

It is also notable that not all sewage-influenced streams behave in the same way. Leigh Brook, which receives discharge from Holmwood STW, remains one of the most phosphate-impacted streams in our dataset, but its pattern is closer to the expected low-flow summer concentration trend. Earlswood Brook appears different, with stronger winter and early spring signals. This contrast is exactly why long-term monthly monitoring is so valuable: it shows not only which streams are polluted, but how each stream responds differently through the year.
Nitrate: the strongest April signal
Nitrate showed the clearest catchment-wide increase this month. The mean nitrate concentration rose from 13.63 mg/L in March to 18.95 mg/L in April. This is also higher than April 2025, which averaged 16.69 mg/L.

The strongest nitrate signal was along the Upper Mole main channel. Our previous April tests have also shown surges in nitrate concentration so this is expected to some extent. The average for the Upper Mole main channel rose to 56.50 mg/L, compared with 35.10 mg/L in the Lower Mole. This is a striking pattern because the Upper Mole is now showing some of the highest nitrate concentrations in the catchment.

Several sites, shown above, saw large increases from March to April. West Vale rose from 29.60 mg/L to 71.80 mg/L, while Stepping Stones rose from 48.30 mg/L to 82.40 mg/L. Sidlow increased from 17.90 mg/L to 40.90 mg/L, Castle Mill from 30.60 mg/L to 51.90 mg/L, and Mole Gap Swanworth Bridge from 30.60 mg/L to 51.50 mg/L.
This pattern is consistent with the seasonal move into low-flow conditions. As dilution weakens, nitrate concentrations tend to become more prominent, especially downstream of major inputs and along the main channel. As in previous warm seasons, many main-channel sites are now moving into Poor or Bad nitrate status as spring progresses.

This rise in nitrate does not necessarily require storm overflow discharges. Nitrate is also a normal by-product of treated sewage effluent, especially when sewage works are successfully converting ammonia into nitrate through biological treatment. In dry weather, when river flows are low, this treated effluent signal can become more concentrated and more visible downstream of sewage treatment works.
Ammonia: mostly low, but local spikes matter
Ammonia remained low across most of the catchment, but the average rose from 0.16 mg/L in March to 0.24 mg/L in April.
The rise in ammonia is mostly explained by a small number of sites rather than a catchment-wide increase.

The most important site this month was Hookwood Common Brook, where ammonia rose sharply from 0.40 mg/L in March to 3.00 mg/L in April. That is a substantial local spike and is consistent with the long-running concern at this stream, which receives discharge from a small private package sewage treatment plant.
If Hookwood Common Brook is excluded from the catchment average, the April ammonia average falls close to 0.15 mg/L, showing how strongly this one site affects the monthly result.

Salfords Stream also rose, from 0.17 mg/L to 0.78 mg/L, while Wallace Brook remained elevated at 0.92 mg/L, similar to March. Wallace Brook continues to behave differently from Hookwood. Hookwood shows a very strong and repeated sewage-treatment signal, while Wallace Brook has shown more variable ammonia elevations that appear less clearly seasonal.
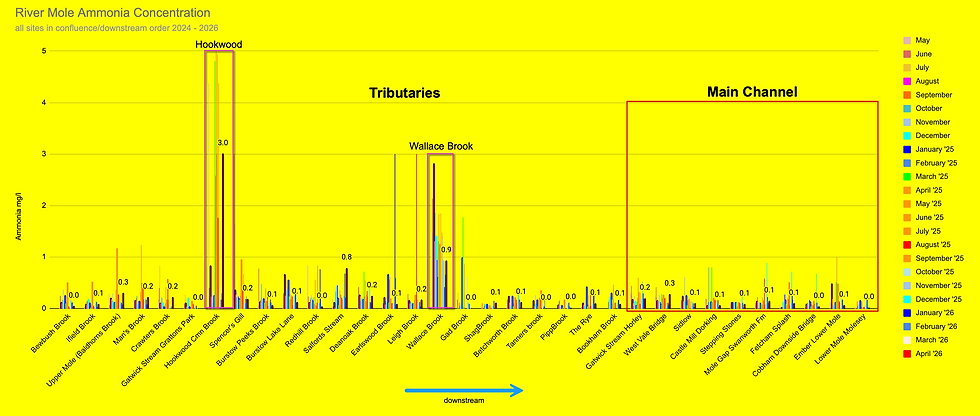
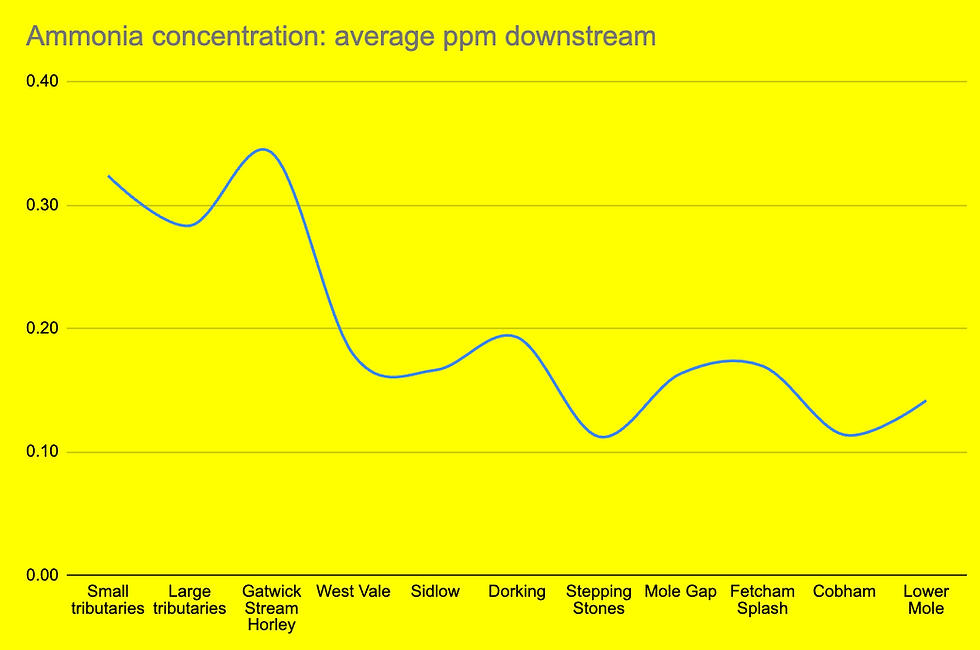
At the catchment scale, ammonia generally declines downstream. This is expected because ammonia is reactive and can be diluted, transformed or taken up as water moves through the system. The main-channel averages remain relatively low compared with the worst tributary hotspots, reinforcing the point that ammonia is often a useful localised alarm for acute pollution rather than a signal for catchment-wide water quality challenges.
Conductivity and temperature: low-flow rebound
Conductivity rose from 557 µS/cm in March to 649 µS/cm in April, very close to April 2025 at 637 µS/cm. This increase is consistent with low-flow conditions and reduced dilution.
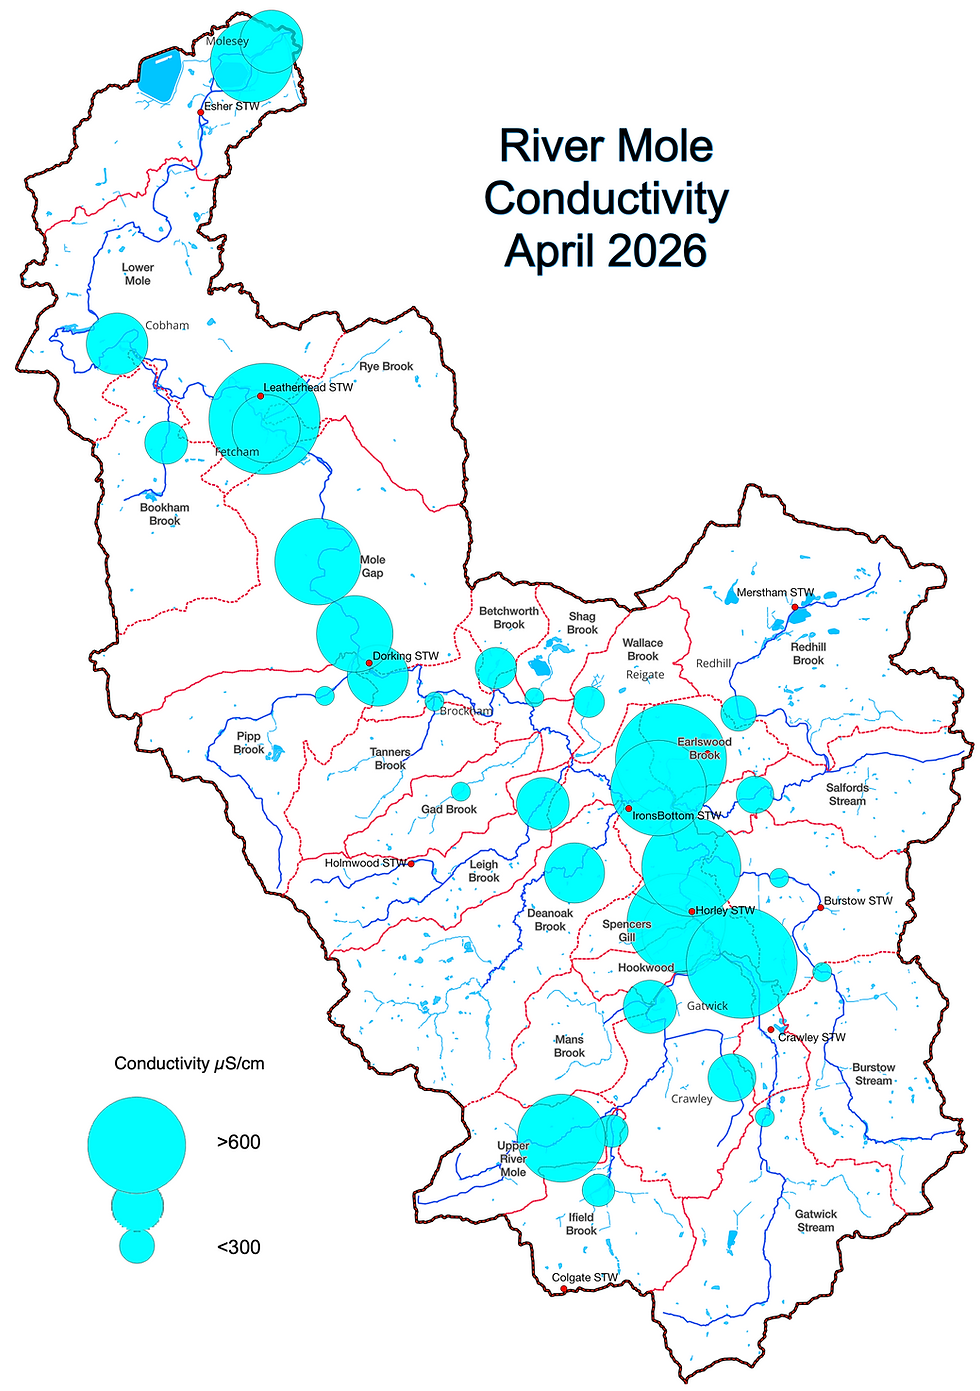
The highest conductivity readings were again found at Earlswood Brook and The Rye, with Earlswood at 1,019 µS/cm and The Rye at 971 µS/cm. Gatwick Stream Horley also rose strongly to 966 µS/cm. These high values suggest that these streams have a consistently high dissolved ion load, which can be associated with effluent influence, urban drainage, groundwater chemistry or a combination of sources. In contrast, Pipp Brook recorded the lowest conductivity in the catchment at 263 µS/cm.
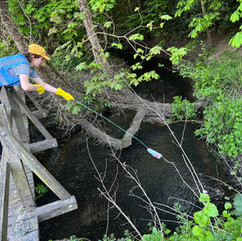
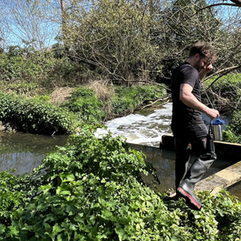
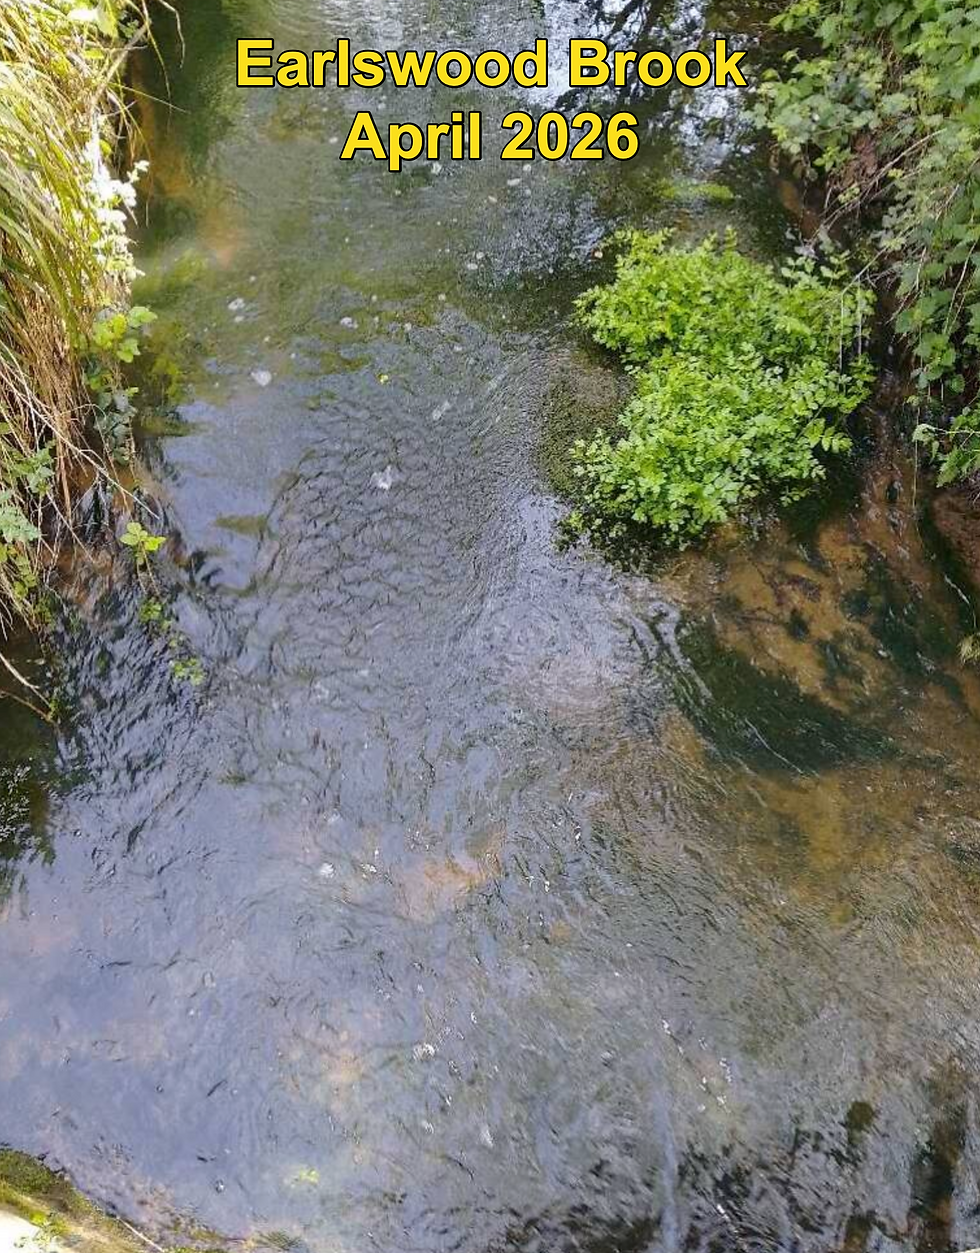
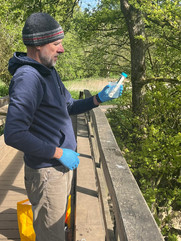
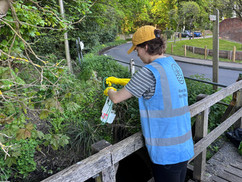
It's worth looking at the two streams shown below, as they perfectly demonstrate how you very often cannot tell the level of pollution just by looking at the water. This point was highlighted by Dr Jess Neumann in her excellent article in The Conversation last month.


Some individual changes were notable. Spencer’s Gill rose from 637 µS/cm in March to 845 µS/cm in April, while Redhill Brook fell from 777 µS/cm to 572 µS/cm.

Water temperature also rose with the dry, sunny weather. Average catchment water temperature increased from 9.5°C in March to 13.5°C in April, just below April 2025 at 14.0°C. This warming is important because higher temperatures can increase biological stress and reduce the resilience of streams already affected by nutrients or low flow.

April 2026 compared with April 2025
April 2026 and April 2025 were both dry spring months, and the overall results are similar in several respects. Phosphate was slightly lower this April (0.62 mg/L) than in April 2025 (0.68 mg/L). Nitrate was higher (18.95 mg/L compared with 16.69 mg/L). Ammonia was lower overall (0.24 mg/L compared with 0.29 mg/L), and conductivity was very similar (649 µS/cm compared with 637 µS/cm).
The difference is the weather leading into April. March 2025 was exceptionally dry, while March 2026 was wetter but still only 50% of normal rain but it followed a very wet February. That makes the April 2026 results particularly interesting: despite wetter conditions earlier in the year, the catchment has quickly moved into the familiar spring pattern of low-flow concentration. This is likely because the clay basin of the Upper Mole releases surface water rapidly and dries up, with minimal base flow available in the predominantly impermeable rocks.
The next few months will therefore be important. If rainfall remains low and temperatures rise, we would expect pollutant concentrations to increase further at vulnerable sites, particularly where streams receive treated effluent or have limited natural flow.
April Summary
April 2026 shows the River Mole catchment moving into its spring low-flow pattern when the influence of treated sewage effluent becomes dominant in many water courses.
Phosphate rose modestly but remained uneven, with hotspots at Leigh Brook and Hookwood Common Brook. Nitrate showed the strongest increase, especially along the Upper Mole, while ammonia was generally low but with local spikes at Hookwood, Salfords Stream and Wallace Brook. Conductivity also rose as dilution weakened, with Earlswood Brook, The Rye and Gatwick Stream Horley again among the highest readings.
Several sites remained in Good or High status, including Gatwick Stream at Grattons Park, Bewbush Brook, Burstow Peeks Brook and Shag Brook. However, a number of tributaries and main-channel sites continue to show Poor or Bad nutrient status as flows fall.


As ever, thank you to our fantastic citizen scientists. Their monthly testing is building a long-term picture of water quality across the Mole catchment, helping us identify hotspots, track trends and provide evidence for action. Thank you for reading — please share this update, consider donating, and help spread the word about River Mole River Watch.


Comments