

March 2026 River Mole water quality update: spring pollution rise, E.coli news, storm overflow trends and a new Earlswood Brook project
Updated: Apr 13
March brought a marked spring shift in River Mole catchment water quality. Across our 33 monitoring sites, phosphate, nitrate and conductivity all rose noticeably compared with February as less rainfall fell, river flows dropped and dilution decreased. This month we review those changing seasonal conditions, examine the main pollution hotspots emerging in the River Mole and tributaries, and compare the latest storm overflow data with recent years to assess whether progress is being made across the catchment.
River Mole River Watch are delighted to announce the launch of our new citizen science E.coli testing project which started on Earlswood Brook in March. A team of newly trained River Mole River Watch volunteers are conducting monthly E.coli tests which will complement our nutrient testing programme and help to inform understanding of the impact of effluent discharge into the brook.
We are prioritizing Earlswood Brook due to the recent pollution issues it has faced from storm overflows, which led to an outbreak of sewage fungus and loss of aquatic life. We intend to establish additional E.coli testing sites and make the data accessible to the public, enabling people to make informed choices about using the river for recreational activities with their families or pets.
In recent news Jess Neumann, a trustee of River Mole River Watch and Associate Professor of Hydrology at the University of Reading, has written this article on identifying signs of river pollution. This is particularly relevant as polluted streams like Earlswood Brook can look crystal clear but are devoid of life due to pollution. Link here:
Citizen Science Data Overview
A huge thanks to our magnificent team of citizen scientists for collecting March data.

After three months in Moderate condition, March saw the River Mole catchment return to overall Bad water quality status with a third of sites reporting Poor or Bad results this month. All our water quality metrics showed a significant uptick in pollution concentration especially nitrate and phosphate.

An upward trend is expected in spring time as rainfall decreases, temperature and evapotranspiration increase and river flow falls. This heralds seasonal increase in concentration of pollutants to an annual peak sometime in June, July or August.
Context for March 2026

March 2026 was much drier with lower-flow and less sewage overflow than February 2026, but it was not as dry as March 2025.
Monthly rainfall to test date was 29.0 mm in March 2026 versus 89.6 mm in February 2026; The River Mole at Leatherhead recorded discharge of 3.2 m³/s in March versus 8.0 m³/s in February; monthly storm overflow duration was 140 hours in March versus 2,428 hours in February; and antecedent storm overflow duration (3-days before testing) was 0 hours in March versus 128 hours in February.
Looking at past years: in comparison to March 2025, March 2026 also experienced below-average rainfall, but it was wetter and had higher flow with more EDM activity than March 2025. Specifically, March 2025 recorded only 3.8 mm of rainfall up to the test date, with a discharge of 2.1 m³/s and 34 hours of antecedent storm overflow. In contrast, March 2024 had significantly more rainfall, with above-average levels of 100 mm, a discharge of 10.0 m³/s, and 2,201 EDM hours.
Let's examine each key pollution metrics in detail:
Phosphate: hotspots along the Upper Mole
Across the 33 test sites, March 2026 mean phosphate was 0.54 mg/L . That is up from 0.35 mg/L in February 2026, a rise of 0.185 mg/L or 52.5%. It is similar to March 2025, which averaged 0.56 mg/L, but clearly above March 2024, which averaged 0.29 mg/L.

Our data shows that the spring increase in concentration has happened earlier this year, as shown above by the sharp rise in phosphate concentration in March '26 and the "jump" in size of the red bars below representing the proportion of Poor/Bad water quality (WQ) tests. Although this March is similar to 2025, the 2026 rise has occurred a month earlier than in 2024, when a wet March resulted in the lowest annual concentration of pollutants in the three year data series.

The earlier start to rising phosphate concentrations may be significant in determining the potential for higher increases if summer turns out to be drier or warmer than average.
The latest MetOffice 3-month outlook for April to June has a 45% chance of the season being warm but a 70% chance that rainfall will be near average.
Although March 2025 was notably dry with a catchment phosphate concentration of 0.56 mg/l, this March's phosphate concentration was surprisingly similar at 0.54 mg/l. This similarity occurred despite the catchment experiencing eight times more rainfall than last March, along with above-average rainfall in January and February.

Although the timing of the phosphate increase is not good news, the distribution is even more concerning. The rise in phosphate levels in March was driven by several sites with especially high phosphate concentrations along the main channel of the Upper Mole, extending from Horley through West Vale to Sidlow Bridge. The prolonged storm overflows from assets upstream of this reach during January and February might be the reason for the elevated phosphate levels we are currently observing in this section of the Upper Mole.

The GIS map below highlights the elevated phosphate levels in the main channel of the Upper Mole catchment, especially from Horley to Sidlow. Leigh Brook and Hookwood Common Brook also stand out with large symbols. After a "break" of 5 months Leigh Brook returns to the highest concentrations our Hanna kits can measure at 2.51mg/l. Phosphate concentrations are noticeably lower elsewhere in the catchment. Of note are the relatively low concentrations in the Lower Mole even downstream of major sewage treatment works at Leatherhead and Esher.
Water quality improves significantly from Poor in the Mole Gap to Moderate at Fetcham and Cobham ... an improvement that continues all the way to the Thames.
This improvement is surprising given that Leatherhead ranked highest for storm overflow duration from January to March, with 942 hours of untreated sewage flowing into the River Mole. For context, the combined storm overflow contributions from major sewage treatment works upstream resulted in over 3000 hours of sewage discharging into the Upper Mole during the same period from Holmwood, Burstow, Horley, Merstham, and Crawley STWs. The transport of phosphate downstream to locations in the Upper Mole may account for the poor status of the Upper Mole.

You can also see the sharp uptick in phosphate in the Upper Mole compared to Lower Mole in the charts below. The "switch" to higher phosphate levels in the Upper Mole relative to the Lower Mole happens every year but seems to be particularly noticeable this year.

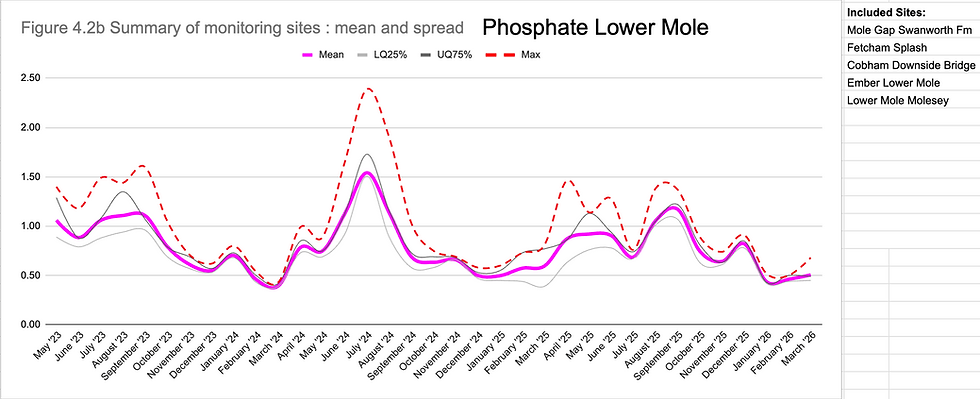
Overall, March still saw the strongest rise in phosphate concentration at test sites which host sewage treatment works (STW) as shown in Figure 3.1 below.

Highest concentrations were found at Leigh Brook 2.51mg/l and Hookwood Common Brook 1.48mg/l (downstream of a package sewage treatment plant) and, as mentioned, particularly concerning phosphate levels in the Upper Mole main channel from Horley to the Mole Gap which averaged 1.02mg/l compared to 0.52 mg/l for March last year.
The charts below show the top 5 "worst" and "best" performing water courses for phosphate. These illustrate the enormous difference between the streams receiving sewage effluent from sewage works and those without effluent inputs.


This March streams with sewage treatment works averaged 2.4x the phosphate concentration of those without as shown by the chart below.

Where we conduct tests at sites located upstream and downstream of major sewage works results don't always exhibit the same rise in phosphate levels downstream. Although Burstow, Crawley and Horley sewage treatment works display a more consistent increase in phosphate concentration, Dorking shows more variability in the difference between our upstream and downstream monthly tests. Interestingly, results for nitrate, ammonia and conductivity also show Crawley and Burstow STWs having the most consistent increase in downstream sites while Dorking and Horley fluctuate more between increase and occasional decrease. Monthly tests only provide a snapshot and our recent work with AquaWatch indicated the value of continuous water quality monitoring through last Autumn.

The detailed investigation we conducted with AquaWatch last autumn included continuous monitoring using Waka sensors set up at sites including up and downstream of Dorking Pixham STW. The results, along with our own monthly monitoring shown below, revealed only a slight increase in phosphate levels between Castle Mill (upstream of the STW outfall) and Stepping Stones (downstream of the STW outfall), with a more pronounced increase in nitrate levels. Unfortunately (!), the data collection period did not include any storm overflow events from the sewage works and ended before the period of extreme sewage effluent discharge in January and February.


Further investigations are ongoing with partners including SERT and our Mole catchment citizen science lead in the EA to research the impact of storm overflow discharges on river health including at Earlswood Brook which experienced enormous damage from the high duration sewage discharges during January and February.
Nitrate : highs in the most vulnerable locations
Mean nitrate in March 2026 was 13.6 mg/L . That is up from 6.88 mg/L in February 2026, an increase of 6.75 mg/L or 98%. However, it remains below March 2025, when the mean was 19.6 mg/L, so March 2026 is 30% lower than March last year.

Similar to phosphate, nitrate concentration saw a significant increase from February to March as shown in the scatter chart below. The biggest increases from February to March were at Stepping Stones (11.5 → 48.3, +36.8), Gatwick Stream Horley (1.4 → 29.8, +28.4), Castle Mill (7.9 → 30.6, +22.7), Downside Bridge Cobham (11.5 → 31.25, +19.75), West Vale (11.8 → 29.6, +17.8), Mole Gap Swanworth Br (14.6 → 30.6, +16.0) and Leigh (9.4 → 25.4, +16.0). Stepping Stones is the most obvious spike, and in this case March 2026 is also well above March 2025 (48.3 vs 25.6). Lower Mole Molesey is another useful signal: 18.1 → 31.4 month on month and above March 2025 (20.0).

Again, similar spatially to phosphate, a notable surge in nitrate occured in the Upper Mole main channel where the average for sites along this reach increased from 8.8mg/l in February to 31.2mg/l in March.

The difference in nitrate concentration between streams with sewage treatment facilities and those without increased substantially in March, with averages of 21.1 mg/l and 2.3 mg/l, respectively.

The GIS map below shows the elevated nitrate levels in Earlswood Brook which returned by far the highest March concentration of 51mg/l with a long term average of 74.5mg/l.
The map also shows the now familiar increase or at least maintenance of nitrate concentration as the River Mole flows downstream into the Lower Mole.
Through the vulnerable Mole Gap reach, where chalk swallow holes allow river water to potentially enter the aquifer, nitrate levels are consistently some of the highest recorded in the catchment and this March was no exception.
Also of note are significant jumps in March nitrate concentration for Leigh Brook 25.4mg/l (up from 9.4mg/l in Feb), Redhill Brook 10.9 mg/l (up from 1.8 mg/l Feb), Burstow Stream Lake Lane 13.5 mg/l (up from 4.8 mg/l Feb), Gatwick Stream Horley 29.8 mg/l (up from 1./4 mg/l Feb) and the Stepping Stones 48.3 mg/l (up from 11.5 mg/l Feb). These sites are all downstream of major sewage treatment works.

Ammonia : highlights localised pollution
Mean ammonia in March 2026 was 0.16 mg/L. That is slightly above February 2026 (0.14 mg/L), a rise of 15%, but much lower than March 2025 (0.35 mg/L).

However, the March '26 average conceals significant spikes on several streams, which are shown in the bar chart below with recent March data labeled.

Wallace Brook in particular has seen a rise this month to 1 mg/l which stands out on the GIS map below showing March ammonia data. Wallace Brook has experienced consistently elevated ammonia levels since we started testing ammonia in April 2024 with a high of 2.8mg/l in August 2024.

Interestingly, while ammonia levels have fluctuated in Wallace Brook it lacks the strong seasonal pattern characterised by Hookwood Common Brook where we know the single source of the problem is a package sewage treatment plant where a permitted outfall discharges into the stream overwhelming the flow with effluent especially at periods of low flow. Ammonia concentration in Wallace Brook seems to behave quite differently with less connection to seasons or changes in flow.

Ammonia concentration usually declines quite quickly downstream of sources and this is particularly evident at the catchment scale shown below.

However, in recent tests conducted along Earlswood Brook, the downstream reduction of ammonia was not clearly observed, albeit the reach tested is quite short at only ~2km.

Earlswood STW effluent discharge is identified clearly as the dominant source of ammonia in Earlswood Brook, indicated by the lower concentration upstream and the sharp increase at the STW outfall which delivers the majority of flow in the stream.

The ammonia concentration remained significantly above 2 mg/l throughout its length, with tests downstream even showing an increase in ammonia concentration in the first kilometer.

Of interest are the bunds, raised banks, surrounding the open field boundaries to the north bank of the brook. These fields were used for sewage sludge processing as part of the original Earlswood treatment works probably until the '70s. The fields contain heavy metal contamination which may have prevented development. A number of pipes can be seen leading through the bunds to allow surface flood water in these fields to drain directly into the brook. It is not known if contamination leaches into flood water.

Whilst much of the filamentous sewage fungus has now gone (there is still evidence of pale coloured sewage deposits), our E.coli test for March showed levels over 5000 cfu/100ml. This means that faecal contamination is present in the water. The test took place with no storm overflows for at least a week. The March E.coli result shows the impact of treated effluent discharge on the stream and is well above government safe limits for water contact (<900 cfu/100ml).
This work is part of a project in collaboration with SERT to enhance this beautiful section of stream. The landscape along Earlswood Brook is a rich and diverse habitat, not least through Felland Copse and into Dovers Farm which is managed for biodiversity so improvement of the stream will be enormously beneficial to wildlife. Public engagement for the project will commence soon.

Meanwhile, it is important to remember that the majority of the flow in Earlswood Brook consists of treated sewage effluent, and during storm overflows events, dilute untreated sewage will be added to the mix. Therefore, improvements in water quality rely on Thames Water upgrading the quality of effluent treatment and the overall performance of Earlswood sewage works. Recent communication with Thames Water to determine the exact cause of the recent catastrophic outbreak of sewage fungus and loss of aquatic life in the stream during January and February has so far resulted in inadequate explanations, and the investigation is ongoing.
Conductivity rebound

Mean conductivity in March 2026 was 557 µS/cm. That is up from 394 µS/cm in February 2026, an increase of 162 µS/cm or 41%, but below March 2025 (609 µS/cm). The strongest rebounds from February to March were at Earlswood Brook (363 → 1014, +651), The Rye (613 → 1010, +397), Upper Mole, Baldhorns (259 → 565, +306), Sidlow (430 → 711, +281), Stepping Stones (396 → 645, +249), Spencers Gill (396 → 637, +241), Mole Gap Swanworth Br (439 → 676, +237) and Gatwick Stream Horley (495 → 729, +234).

Earlswood Brook again stands out very clearly here because March 2026 has returned almost exactly to its March 2025 conductivity level (1014 vs 1001) after a very low February. The Rye shows a similar rebound pattern, rising sharply month on month and back close to last March. These two streams, the Earlswood Brook and Rye, rank clear first and second in the conductivity "league table" with their long term average conductivity substantially higher than all other test sites at 820 µS/cm and 766 µS/cm respectively. For context, Redhill Brook is third in rank order at 683 µS/cm.
Storm Overflow trends in the River Mole catchment: Are Thames Water on target?

Alongside our nutrient testing, we also regularly review storm overflow activity across the catchment using Thames Water API data and the Environment Agency’s annual Event Duration Monitoring (EDM) release. This helps us track how spill frequency and duration are changing over time, cross-check patterns seen in water quality data, and identify assets that may be placing particular pressure on vulnerable streams such as Earlswood Brook.

There are over Thames Water 300 sewage pumping stations in the River Mole catchment.
Each pumping station pushes raw sewage through the sewer network to one of 11 STW for treatment. In addition to pumping stations, there are two combined sewer overflows (Bentsbrook and Millbank) and one storm sewer overflow (Stonebridge, Brockham). Each one of these assets is capable of failing and causing sewage to spill directly onto land or into water or to surcharge from somewhere on the network such as connected manholes.
Only 30 of these assets have "live" Event Duration Monitors installed so this leaves a lot of undetected spills unless people observe them and report them.

An example of an unmonitored spill is the manhole situated between the Stonebridge storm sewer overflow and the Castlefields pumping station near Brockham. This manhole often discharges raw sewage and "rag" (foul debris) onto the land, eventually flowing into the nearby River Mole. Reports of this issue have been made to the EA and Thames Water for a long time, with ongoing efforts from a partnership of Dorking anglers, local residents, and RMRW urging Thames Water to address the problem. Thames Water has visited the site and attributes the spills to, amongst other things, an under-capacity sewer servicing the Dorking sewage treatment works.
"Government to cut sewage pollution in half by 2030"
For the 30 or so monitored assets capable of spilling, there are now several overlapping "targets" which can be used to assess progress in reducing storm overflows: a long-term goal set by Defra to prevent storm overflows from causing ecological harm by 2050, an interim government target announced by Steve Reed to cut spills by 50% by 2030 using 2020 as a baseline, and a commonly referenced operational benchmark to limit spills to no more than ten spills per overflow annually. Together, these targets provide a framework for assessing whether Thames Water assets in the Mole catchment are on track to achieve these objectives.
Looking first at the whole catchment, the most recent data for 2025 shows a reduction in total recorded spill duration and spill count compared with the higher levels seen in 2023 and 2024. This brings overall hours closer to those observed in 2022, a similarly dry year. However, when viewed across the full period and with all assets, the pattern remains variable and highly reactive to rainfall and does not show any steady decline or systemic improvement.
Periods of improvement due to drier weather have been followed by increases due to wet weather. While 2025 was a more favourable year due to less rainfall, it does not yet establish a clear long-term downward trend in spill duration or count across assets in the River Mole catchment, not least because in the first 2 months of 2026 the duration of storm overflows has nearly equalled the whole of 2025.

Storm overflows are installed in sewage treatment works (STW) as part of their design so it is not surprising that wetter weather increases sewage spills. Nevertheless, the relationship between rainfall and storm overflow activity is an important part of interpreting the data. This was highlighted by OfWat in its May 2025 decision to issue an enforcement order and impose a financial penalty on Thames Water.
"Ofwat identified that most of Thames Water's WWTWs have storm overflows associated with them that spill regularly to the environment. In 2021, for example, over 70% of storm overflows spilled on 20 or more occasions, with almost 30% spilling on more than 60 occasions. Thames Water failed to demonstrate that these spills resulted from exceptional circumstances, or that it would have been excessively costly to address the spills from these storm overflows." OfWat 2025
Four years later the equivalent statistics for the River Mole's WWTWs are even worse with 100% of WWTW storm overflows spilling on 20 or more occasions, and almost 90% spilling on more than 60 occasions. There is little evidence in the Mole catchment of Thames Water improving trends.

The scatter plot above shows the strong association between annual rainfall totals and annual storm overflow duration across the catchment, with wetter years corresponding to higher spill hours. As said, this is expected to some degree, as storm overflows are designed to operate during periods of "exceptional" rainfall. However, currently many storm overflow assets are extremely reactive to rainfall meaning they start to spill after only small accumulations of rain sometimes less than 10mm. This is illustrated in the chart below which indicates how even the small rain events in March triggered prolonged storm overflows from some STWs.

Storms with total rainfall equating to return periods as little as 2-years have caused very long duration spills. In a more resilient system, only higher-intensity rainfall events with long return periods would trigger significant spill activity. Over time, meaningful improvement would be expected to see reductions in the sensitivity to rainfall, with similar levels of rainfall resulting in fewer and shorter spill events. We do not see any evidence of this happening yet in the Mole catchment. Indeed....
Early data for January to March 2026 suggests a woeful picture with well over 6000 hours of spill duration which is close to the total for 2025.

By the end of February 2026 a number of sites such as Leatherhead, Holmwood and Burstow STWs, had recorded very large spill durations as shown in the GIS map above and the chart below. Whilst a wet start to the year none of the individual rainfall events that triggered storm overflows were "exceptional" events as they had return periods less than 5 years.

As in previous years, a relatively small number of assets, including all of the large STWs, accounted for a large proportion of the total in the first two months of 2026. These larger assets also discharge the greatest volumes of untreated effluent during storm overflows. This concentration of activity is a consistent feature of the catchment and is important when interpreting both annual totals and local impacts. Nonetheless, although lower duration, some smaller pumping stations and CSOs have a disproportionately large ecological impact because they spill into vulnerable water courses. This includes unmonitored assets such as the private package sewage treatment plant on Hookwood Common Brook.
Trends in Storm Overflow Duration
For large STWs in the catchment, storm overflow data over several years shows a mixed picture. Only a handful of the 9 large STWs, such as Earlswood, Dorking and Merstham, have demonstrated decreases in spill duration since 2019. However, this is partly because they had high spill durations to start with, as depicted in the charts below.

Other STWs, such as Holmwood, Burstow, Horley, Esher, Crawley and Leatherhead, continue to record high spill durations. In these cases, although there may be year-to-year variation, the overall level of frequency and duration of spills remains high and in some cases such as Esher, Crawley and Horley even increasing.

There are some sites where there have been very significant increases in spill duration since 2019 as shown in the chart above. These are mainly smaller assets such as pumping stations and CSOs. Ironsbottom, a small STW near Sidlow, is the clear leader rising from a relatively low spill duration baseline of around 24 hours per year, to substantially higher recent durations, exceeding 1,000 hours in 2025. This site, alongside Millbank CSO, Stoke Road SPS and Brockham Bridge PS, all appear to go against recent trends of rainfall totals with spills increasing possibly due to local growth or capacity pressures elsewhere on the sewer network.

Trends in Storm Overflow Count
All large STWs in the catchment record high spill counts every year, while only a limited number of sites fall close to lower spill frequencies. As with duration, improvement is evident at some locations, but it is not yet consistent across the catchment.

Despite 2025 being one of the driest years since spill data became available, all large STWs exceeded the target of 10 spills.

Overall, the EDM data suggests that while there are a few major STWs showing modest improvement trends, such as Earlswood STW and Dorking STW, progress amongst the rest remains very uneven and too strongly connected to rainfall. The catchment does not yet show a clear and sustained trajectory towards lower spill frequency and duration across all assets.
Overall, Thames Water’s performance in the Mole catchment still appears too strongly controlled by rainfall.
Conclusion
Overall, March 2026 appears to mark an early return to the familiar spring pattern of rising pollutant concentrations as flows fall and dilution weakens. Phosphate and nitrate increased sharply at a number of key sites, especially in the Upper Mole and downstream of sewage treatment works, while ammonia remained more localised but still highlighted ongoing pressure in some vulnerable streams, particularly Earlswood Brook. Our storm overflow review also suggests that, although a few assets show improvement, catchment-wide progress remains uneven. As ever, huge thanks go to our citizen scientists whose careful monthly testing makes this analysis possible and continues to build an invaluable long-term picture of river health across the Mole catchment and provides evidence and leverage to tackle polluters.


Comments