
River Mole Winter Report: When Pollution Spikes Overwhelmed Dilution
- Mar 5
- 8 min read
Updated: Mar 6
River Mole River Watch citizen science reveals how storm overflows pushed pollution higher during the season rivers should have lowest pollution concentration.


This winter our dedicated citizen scientists have been out testing in rain and flood conditions, and their data are now revealing a clearer and more detailed understanding of how the River Mole behaves during winter high flows and prolonged periods of sewage overflow activity. Within this growing dataset, some concerning signals are emerging — including pollution spikes that appear to coincide closely with extended storm overflow sewage discharges.
Winter should normally be the season when river pollution concentrations are lowest — yet this year some streams recorded their highest levels during the very period when dilution should have been strongest.
This winter’s results highlight several important findings. The wetter winter produced sustained high river flows that, as expected, lowered average pollutant concentrations across much of the catchment through dilution. Dilution is the natural process by which higher winter river flows disperse pollutants within a larger volume of water, reducing their concentration and generally reducing the potential harm they cause to wildlife and people.

The effect of dilution is a now a familiar seasonal pattern in our dataset since we began monitoring in 2023 as shown in the phosphate concentration charts below, we see similar patterns in other pollutants.


Usually, high river flows correlate with lower pollution concentrations, particularly at catchment scale, as shown in the scatter chart below comparing average monthly catchment concentrations with river discharge at Leatherhead (a good proxy for overall river flow as it sits roughly mid-catchment).

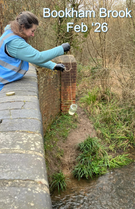
Winter is therefore normally the period of least chemical stress for rivers. Higher flows dilute pollutants and reduce concentrations, even though the total pollutant load carried downstream may increase, and streams may appear cloudier and more laden with brown sediment during periods of high flow, as shown in the comparison pictures below.
Rivers can sometimes look bad without acting bad, but equally can act bad without looking bad! This is why testing is needed as well as observation.


For this reason winter is typically when rivers experience their lowest pollution concentrations of the year. However, this winter a number of sites diverged sharply from this expected behaviour: pollution spiked despite strong dilution conditions created by high river flows.


Notably, this winter, Earlswood Brook, Hookwood Common Brook, Wallace Brook, Redhill Brook and Salfords Stream have all experienced spikes in some or all of phosphate, nitrate and ammonia tests despite strong dilution conditions created by high flows. From a hydrological perspective this means that the input (load) of pollutants entering these water courses must have increased sufficiently to overwhelm the dilution effect of higher river flow.
Without doubt the most striking example is Earlswood Brook, just south of Reigate, where prolonged storm overflow discharges through January were followed by an unusual spike in ammonia and phosphate putting the stream into the "Bad water quality" classification.

For context, winter ammonia concentrations were the highest recorded in Earlswood Brook and phosphate concentrations reached levels higher than any season since summer 2023.

Overall, this winter, across the catchment, things have not been encouraging. Around 80% of tests in December, January and February failed to reach Good ecological status under Water Framework Directive thresholds. This means that while average winter conditions place the catchment overall within Moderate status, more streams than in previous years experienced Poor or Bad water quality.

In this post we look at what happened during this persistently wet winter — how rainfall, high river flows and thousands of hours of storm overflow activity interacted with river chemistry. The chart below shows phosphate results for each winter monitored so far. Several sites spring out as interesting, for example Betchworth Brook is one we must look at in detail soon, but in this post we take a special look at Earlswood Brook.


This winter (DJF = December 2025–February 2026) was notably wet and rivers were frequently at or over bankful. Total DJF catchment rainfall reached 369 mm, compared with 254 mm last winter and 340 mm in winter 2023. Most of the rainfall this winter was concentrated in January and February.

While it rained on more than half the days and Surrey had its third wettest winter on record, no individual rainfall event exceeded a two-year return period threshold. It rained frequently but there were no exceptionally intense rainstorms in the River Mole catchment. The result was a series of moderate flood events and consistently high river flows, with the Mole often in spate through January and February but fortunately there were no major floods.

High winter flows typically produce lower pollutant concentrations through dilution and this winter was no exception. The seasonal decline in concentration — even as total pollutant load increases — is one of the strongest and most consistent signals in our dataset especially for phosphate and nitrate.

The seasonal signal is somewhat weaker for ammonia due to the majority of low values for most test results with only a few localised extremes skewing the average.

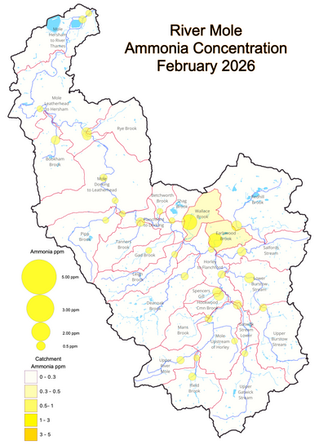
However, for ammonia, there is a strong spatial decline downstream, showing the rapid chemical breakdown into other forms with distance from sources. This also shows how ammonia is a useful indicator of localised pollution.

While weaker, our conductivity results also show a connection with season and river flow with a dip in Winter 2024, a strong peak during the dry Spring of 2025, a second peak through Autumn and another decline in Winter 2025.

Storm Overflows and an unusual Winter “Bad” Classification
This winter saw almost 6,000 hours of recorded storm overflow activity across the catchment, with 2,397 hours in February alone. The total storm overflow duration for 2025 was 6928 hours (preliminary figure from Thames Water API).

Between 20 January and 1 February, during one of the wettest spells of the winter, around 4,000 hours of storm overflow discharges into the River Mole were recorded. In the week immediately before our January sampling weekend, Earlswood Sewage Treatment Works discharged untreated sewage into Earlswood Brook for well over 100 hours. Shortly afterwards, our volunteers measured ammonia at 3.00 mg/L.

Under our localised Water Framework Directive (WFD) thresholds, an ammonia result of 3.00 mg/L falls well within the “Bad” water quality status category. What makes this result particularly striking is that it occurred during sustained high flows, when dilution would be expected to reduce concentrations.
Earlswood Brook: where pollution load overcame dilution


The seasonal trend in ammonia shown above at Earlswood Brook illustrates just how unusual this winter was. Seasonal ammonia averages from summer 2024 onward show the winter 2025 average of 1.23 mg/L is extraordinary in context. It is nearly three times higher than the previous seasonal peak (0.43 mg/L) and far above typical summer values when concentration would be expected to be higher with lower flows. Furthermore, this is the first time in our testing series that a metric has spiked beyond summer concentrations during winter high flows.
This unprecedented winter average in Earlswood Brook was driven largely by the January measurement of 3.00 mg/L, recorded immediately following prolonged storm overflow discharge from Reigate Earlswood STW, some 100 hours of untreated sewage overflow discharged into the stream during the previous week.

Earlswood also shows an unusual pattern in phosphate. Earlswood’s winter 2025 phosphate average of 0.93 mg/L, is more than double last winter’s value of 0.43 mg/L. The chart above also shows how Earlswood phosphate increased markedly this winter while two comparison sites decreased. Furthermore, while Wallace Brook and the Lower Mole follow a more typical pattern of highest concentration in summer, Earlswood is unusual in peaking in winter and spring, at least in recent years in our test record. Remarkably, this winter pollution concentration exceeds spring and summer 2025 levels and is higher than any test recorded since summer 2023.
To see winter concentrations exceed summer averages under sustained dilution conditions is highly unusual.
It suggests that pollution inputs were large enough to overwhelm the natural dilution provided by high river flows.
We cannot be confident yet of asserting direct causation between high ammonia and phosphate concentrations in Earlswood Brook and prolonged storm overflow duration from Reigate Earlswood sewage treatment works. River water quality reflects multiple interacting pressures including other misconnections upstream and sediment disturbance.
However, hundreds of hours of untreated effluent discharge followed immediately by acute ammonia and phosphate spikes and a serious outbreak of sewage fungus along a 1km stretch of Earlswood Brook, seems to strongly suggest sewage discharge is the most plausible driver. The Environment Agency has been informed and are actively investigating. We will keep you updated.
Catchment-Wide Picture: 80% fail to achieve Good status


Across all 33 monitoring sites this winter:
Phosphate averaged around 0.41 mg/L, slightly above last winter despite wetter conditions. This falls into the Moderate water quality class.
Nitrate was lower than last winter at 6.67 mg/L, but this is still at the top end of the Moderate class, near Poor.
Conductivity was lower than last winter.
Ammonia was slightly higher catchment-wide, influenced mainly by Earlswood Brook in addition to Wallace and Redhill Brook and Salfords Stream.
Lower nitrate and conductivity are consistent with dilution from sustained high flows.
Water Framework Directive compliance presents another concerning view.
Using localised phosphate thresholds...
80% of sites failed to reach Good status this winter, compared with roughly 71% last winter and 73% in winter 2023.
Although average concentrations are in line with previous seasonal trends, the proportion of sites failing to meet Good ecological status has increased this winter.
Structural Signals: STWs and Downstream Enrichment
Phosphate:

Streams hosting sewage treatment works continue to show roughly double the phosphate concentration of non-STW headwaters.

This difference is most pronounced in summer but remains visible even during winter high flows as shown in the chart above. The STW phosphate signal is robust with nearly twice the concentration in streams with STWs.

Downstream phosphate enrichment along the main channel is also a persistent feature this winter with the Lower Mole again exceeding the Upper Mole in phosphate and nitrate, a pattern that is strongly reversed in summer. This winter:
Upper Mole phosphate: 0.39 mg/L
Lower Mole phosphate: 0.55 mg/L
Last winter showed a similar pattern (0.38 upstream vs 0.53 downstream).
Ammonia:
Following the Earlswood Brook ammonia spike, we can also look further into how sewage treatment works (STWs) influence ammonia levels at whole-catchment scale. The chart below compares seasonal average ammonia concentrations in streams that host STWs with those that do not.

As shown, for most of the year, ammonia concentrations are typically lower downstream of sewage treatment works, reflecting the effectiveness of modern treatment processes in removing ammonia from wastewater before discharge. However, during winter this pattern seems to reverse. The chart shows that streams hosting STWs recorded higher ammonia concentrations than streams without STWs during winter months.
This seasonal reversal is again notable because winter high flows dilute pollutants across the catchment. For concentrations to increase under such conditions, the input of ammonia must rise faster than the dilution effect created by higher river discharge. One plausible explanation is the increased operation of storm overflow outfalls during prolonged rainfall, which can discharge untreated or partially treated wastewater directly into receiving streams, bypassing the ammonia removal processes that normally occur within treatment works.

Earlswood Brook provides a clear illustration of this effect. The ammonia spike this winter observed occurred in a stream hosting a sewage treatment works and followed a prolonged period of storm overflow discharge, consistent with the wider catchment pattern shown in the seasonal comparison. This is as near to finding a "smoking gun" as citizen science can get.
Final Perspective
Winter 2025 was wetter than last winter, with sustained high flows and repeated moderate flood events. Dilution effects are visible in some reduced overall catchment concentrations.
And yet, in certain tributaries and locations, nutrient inputs were sufficient to overcome that dilution and cause damaging spikes in concentration.
This winter around 80% of phosphate results failed to reach Good status. Earlswood recorded a Bad ammonia classification during a period of prolonged overflow discharge. Structural STW nutrient signatures remain visible across the catchment and show little signs of improving water quality.
Winter should normally represent the period of lowest pollution stress for river ecosystems. The fact that severe pollution spikes are appearing even during this naturally diluted season suggests that pollution pressures in parts of the Mole catchment remain both persistent and systemic.
It is concerning to report that persistent nutrient enrichment, episodic spikes of toxic pollutants and widespread WFD non-compliance remain defining features of winter 2025.


Comments