

Summer 2026: When the Mole runs low, new pollution shows!
Summer 2026
Record heat, vanishing flows and late-summer rain exposed new nutrient hotspots across the River Mole catchment.
Summer 2026 gave the River Mole an exceptional stress test : record heat, no rainfall in the catchment during July, extremely low flows and the river itself vanishing through the Mole Gap. Our monitoring revealed several important changes.
Treated sewage effluent became visibly important to the river’s flow. Daily “wastewater tides” could be traced through the gauge network, while the July water-supply interruption provided unusually direct evidence that reduced wastewater production led to reduced river flow.
August produced some of the poorest water-quality results we have recorded. 97% of tested sites were Moderate, Poor or Bad for phosphate, with Deanoak Brook jumping from a more typical mid-ranking position to become the worst-ranked site in our combined August pollution score.
Ammonia reached its highest summer levels in our recent record in first-order streams and larger Upper Mole tributaries, with several severe local hotspots.
Nitrate moved in the opposite direction, falling markedly across every water-body group compared with 2024 and 2025. Why this is happening remains an important question.
The first substantial rainfall after the prolonged drought exposed sharp nutrient spikes in several predominantly agricultural catchments. Exceptional low flows may have made intermittent pollution from fields, farm drainage, livestock areas, septic systems and other rural sources much easier to detect than in a wetter summer.
The results show how the Mole behaves when natural flow dwindles, treated effluent dominates flow and some pollution signals intensify. Summer data has provided us with a valuable baseline for investigating wastewater treatment and rural land-use pressure.
Record heat, low flows and effluent "tides"
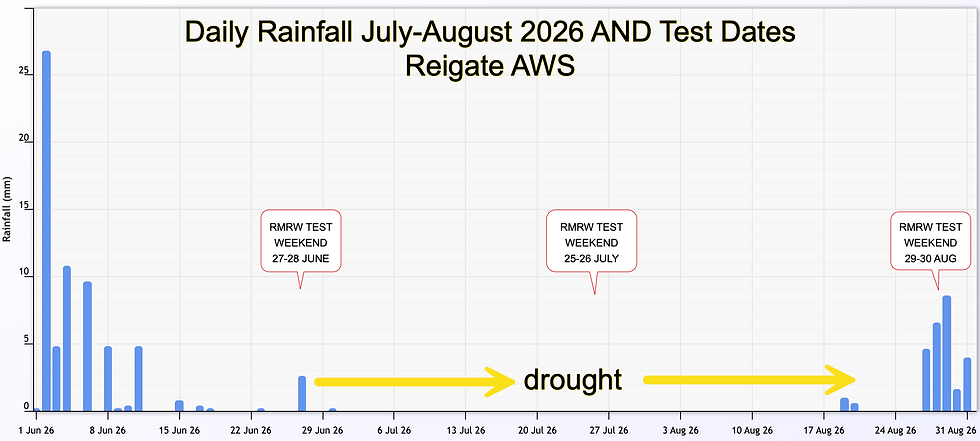
Summer 2026 pushed the River Mole into exceptional low-flow conditions. RMRW recorded no rainfall in the catchment during July, while the Met Office confirmed that England had its driest July on record in a series dating back to 1836. Our own local Reigate weather station recorded 52 days without rain (data courtesy of Andy Herrod). Across the June–August test rounds, average monthly rainfall recorded up to each test date was just 32 mm — the lowest of the four summers we have compared. Average Leatherhead river flow during those test periods fell to 0.93 m³/s, around 43% below the 2023–2025 average.
By early August, the Mole had vanished from much of the surface channel through Norbury between the swallow hole at Mickleham and the springs at Thorncroft Bridge. The river stopped flowing on the surface between 1-29 August. Isolated pools, separated by bone dry stony riffles, became smothered in duckweed and algae. The concurrent heatwave, dwindling dissolved oxygen and increasing algal blooms led to the EA conducting a fish rescue on 12-13 August. This “vanishing” deserves its own story, and we will post a separate article on this important event soon.
One of the clearest features of the remaining surface flow which ran all summer upstream and downstream of the Norbury reach, was the daily influence of treated sewage effluent. Through long rain-free periods, gauges repeatedly rose and fell with the daily rhythm of wastewater production — morning and evening peaks from washing, flushing, showers and other water use passing through sewage treatment works before returning to the river as treated effluent. We call these repeating pulses the river’s “wastewater tides”: not real tides, but a visible daily peak of treated wastewater moving downstream. In summer 2026 the signal could be followed through much of the Mole system, unusually reaching as far downstream as Esher. RMRW documented these several-centimetre daily fluctuations throughout the summer.

A major water-supply failure affecting parts of the Mole catchment on 26 July provided an unusual natural experiment. A power failure at SES Water’s Bough Beech works caused loss of supply around Horley and Gatwick. With less mains water being used, less wastewater subsequently reached the sewage works. The resulting river response gave us unusually direct evidence that treated effluent was helping to sustain flow during the drought.
Storm overflow activity during the summer was confined to early June, with no storm overflows at all recorded in July or August. There were also no storm overflows prior to testing. However, the river remained strongly influenced by sewage throughout the dry summer because treated effluent continued to enter it every day and became a higher proportion of the flow as natural baseflow diminished through the drought. In extreme low flows, the quality of that treated effluent — and how well the treatment works perform — becomes particularly important to the health of the Mole. It is the quality of treated effluent that we continue to raise with Thames Water as a priority.
How does summer 2026 compare with previous summers?

Compared to previous summers, in JJA 2026 phosphate became particularly concentrated in first order streams (smallest streams) and the Lower Mole; ammonia increased sharply in several tributaries; nitrate fell markedly compared with recent summers; and conductivity rose across every water-body group.
For these seasonal comparisons we grouped monitoring sites into first-order streams (smallest streams), the larger Upper Mole main tributaries (i.e. Gatwick Stream, Salfords Stream, Burstow Stream and the Upper Mole), the main River Mole channel (i.e. Horley to Esher) and the Lower Mole (i.e. Molesey and Ember).
Phosphate: worst in smallest streams and the Lower Mole but are there hints of improvement downstream of sewage works?
Overall, average catchment phosphate concentration was higher in 2026 than 2025 but a tad lower than 2023 and 2024. However, there were important contrasts between different streams: first-order streams and the Lower Mole recorded their highest means, while the larger Upper Mole tributaries improved.

The 2026 June–August mean for first-order streams rose to 0.92 mg/L, the highest in our four-summer comparison, from 0.63 mg/L in 2025 and 0.58 mg/L in 2024 and 0.77 mg/L in 2023.
The Lower Mole also recorded its highest summer concentration mean at 1.13 mg/L, compared with 0.77 mg/L in 2025 and 0.91 mg/L in 2024.
By contrast, the larger Upper Mole tributaries averaged 0.99 mg/L, lower than 1.18 mg/L in 2025 and substantially below 1.54 mg/L in 2024. The main channel averaged 1.10 mg/L: higher than 0.93 mg/L in 2025, but below 2023 and the particularly poor summer of 2024.
Given the exceptional low flows it might seem surprising that phosphate concentration was not much higher than previous years.

The smallest tributaries deteriorated markedly and the Lower Mole recorded its highest summer concentration average.
There were notable reductions in phosphate concentration in the Upper Mole main tributaries... these sites are downstream of major STWs.

The difference between phosphate concentration in streams influenced by major STWs and those without major STWs narrowed in summer 2026.
Nitrate: a striking decline

Summer nitrate concentrations fell across every water-body group, despite exceptionally low summer flows.
In the main channel, the summer mean fell from 62.68 mg/L in 2024 to 46.11 mg/L in 2025 and 34.10 mg/L in 2026. The Lower Mole fell from 46.83 to 33.83 and then 26.38 mg/L. Upper Mole tributaries declined from 39.80 to 36.07 and then 25.28 mg/L, while first-order streams fell to 1.96 mg/L from 2.82 mg/L in 2025.
Nitrate concentrations still remained higher in the larger river system than in small tributaries, particularly in the Mole Gap through to the Lower Mole, but the overall decline in nitrate over the past three summers is striking.
The drought itself may be part of the explanation. With very little rainfall, less nitrate may have been washed from soils into streams. Warm, sunny and slow-flowing conditions can also increase nitrate uptake by plants, algae and biofilms, while denitrification by bacteria can remove nitrate where conditions are suitable.
Changes in wastewater treatment may also be part of the explanation, but a decline in nitrate does not necessarily directly point to improvements in sewage treatment works. Nitrate is not routinely targeted for removal from wastewater at all treatment works. RMRW is already raising these findings with Thames Water and we will report back as we make progress in understanding these results.
Ammonia: worst summer levels on record!
Ammonia was a major concern in summer 2026, reaching the highest summer mean in our 2024–2026 comparison for both first-order streams and the larger Upper Mole tributaries. This is concerning because elevated ammonia is one of the indicators of acute sewage or organic pollution.

The summer mean for first-order streams rose from 0.39 mg/L in 2024 and 0.47 mg/L in 2025 to 0.84 mg/L in 2026. In the larger Upper Mole tributaries it rose from 0.21 mg/L in 2024 and 0.32 mg/L in 2025 to 0.76 mg/L in 2026.
The main channel increased more modestly, from 0.14 mg/L in 2024 and 0.17 mg/L in 2025 to 0.24 mg/L in 2026. In sharp contrast, the Lower Mole fell to just 0.04 mg/L, compared with 0.12 mg/L in 2024 and 0.13 mg/L in 2025.
Importantly, the increase was not concentrated in the reaches most strongly influenced by the major sewage treatment works. Our monitoring has generally found relatively low ammonia in reaches downstream of STWs. This is consistent with sewage treatment substantially reducing ammonia before discharge, often by converting it to nitrate.
Instead, the strongest ammonia signals were concentrated in smaller tributaries and local hotspots. Hookwood Common Brook and Wallace Brook remained familiar problem sites, while August also produced particularly high readings at Deanoak Brook (2.70 mg/L), Salfords Stream (1.70 mg/L), Spencer’s Gill (1.10 mg/L) and Crawter’s Brook (1.10 mg/L). Hookwood Common Brook reached 4.30 mg/L.
This points towards more local sources of pollution. Septic tanks, package treatment works and local wastewater failures remain possible in some catchments, while animal waste and agricultural runoff are also plausible.
Several new August ammonia hotspots occurred in predominantly agricultural catchments after rainfall returned — a pattern we examine below.
Conductivity: record highs across the catchment
Conductivity was higher in 2026 than in either 2024 or 2025 across every water-body group consistent with extreme low flows concentrating dissolved salts and ions. Notably, this happened while nitrate concentrations were falling.

The largest increase in conductivity was in Upper Mole tributaries, where the summer mean rose from 669 µS/cm in 2025 to 818 µS/cm in 2026. The main channel rose from 711 to 809 µS/cm, the Lower Mole from 729 to 801 µS/cm, and first-order streams from 542 to 585 µS/cm.
Conductivity reflects the overall concentration of dissolved salts and ions in the water rather than any single pollutant. The widespread rise in 2026 is therefore consistent with exceptionally low river flows providing much less dilution for dissolved material entering from treated effluent, groundwater and other catchment sources.
The contrast with nitrate is notable: conductivity rose strongly while nitrate fell. This shows that the drought was not concentrating every dissolved substance in the same way.
August 2026: new pollution hotspots emerge

August exposed widespread phosphate pressure across the catchment and the sudden appearance of some new sites among our worst-performing streams.
Of the 31 sites where phosphate could be tested, 97% fell into RMRW’s Moderate, Poor or Bad phosphate bands.
Only Shag Brook, at 0.05 mg/L, remained in the High/Good range.
The Bad phosphate results were at Hookwood Common Brook (2.51 mg/L), Leigh Brook (2.51 mg/L), Spencer’s Gill (2.50 mg/L) and Deanoak Brook (2.50 mg/L).

On RMRW’s combined August pollution score, Deanoak Brook and Hookwood Common Brook ranked as the two most polluted sites tested, followed by Salfords Stream, Leigh Brook and Spencer’s Gill. Several were poor for more than one parameter.
Deanoak combined phosphate at 2.50 mg/L with ammonia at 2.70 mg/L and the highest conductivity of the round at 1,426 µS/cm. Hookwood Common Brook recorded 2.51 mg/L phosphate and 4.30 mg/L ammonia. Salfords Stream recorded 1.83 mg/L phosphate and 1.70 mg/L ammonia, while Spencer’s Gill combined 2.50 mg/L phosphate with 1.10 mg/L ammonia.

Some of these are familiar pollution hotspots. Hookwood Common Brook has a long-running ammonia and phosphate problem associated with local wastewater inputs from Farmfield Hospital, while Leigh Brook remains heavily affected by effluent discharge from Holmwood sewage treatment works. But other August results were much less familiar. Deanoak Brook was the standout change, jumping from a mid-ranking position in our long-term pollution table to the worst overall score in August. Salfords Stream and Spencer’s Gill also moved into the group of worst-performing sites.

Nitrate again showed a different pattern. The highest concentrations of nitrate remained largely associated with the main river and lower catchment, with Earlswood Brook, fed largely by Reigate STW, the usual notable exception at 56.6 mg/L. The River Mole reached 55.1 mg/L at Downside Bridge, Cobham, 45.9 mg/L at Fetcham Splash, 41.0 mg/L at Ember and 40.8 mg/L at Molesey.
This reinforces the seasonal picture: the strongest nitrate signal remained in the larger river system, while the most severe ammonia problems were concentrated in individual tributaries.
The timing of our August testing may be important: it followed the first meaningful rainfall after the prolonged drought, with 7.8 mm falling in the three days before sampling. Several of the new worst-performing streams drain predominantly agricultural catchments.
Bookham Brook remained completely dry throughout the summer and Man’s Brook dried up in August, another indication of just how severe the low-flow conditions had become.
Chronic pollution therefore remained severe at familiar hotspots such as Hookwood Common Brook and Leigh Brook.
The more unusual August finding was the sudden rise of streams such as Deanoak, Salfords and Spencer’s Gill into the worst-performing group. All drain catchments with substantial agricultural land cover.
Rain after drought: is there an emerging agricultural runoff signal?

The exceptional low flows of summer 2026 may have revealed pollution signals that we have not seen as clearly before. In particular, the August results appear to expose sharp nutrient spikes in several predominantly agricultural catchments, where possible sources include leaky septic tanks, runoff from cropped land, and runoff from cattle or sheep fields. These inputs may be intermittent and, in more normal flows, diluted or simply missed between monthly sampling rounds. It so happened that our August test followed the first substantial rainfall after a prolonged hot, dry spell through July and much of August.
That is what makes the late-August results particularly interesting. Several streams draining catchments with substantial agricultural land cover showed sharp increases in phosphate, ammonia and conductivity.

Deanoak Brook is the clearest example and also caught the heaviest showers preceding testing. Spencer’s Gill, Salfords Stream and Betchworth Brook produced similarly concerning summer results. These are predominantly agricultural catchments, as shown in the maps below. For balance, the Rye has a more mixed land-use pattern and Crawters Brook is a highly urban catchment. Both also experienced spikes at times during summer in ammonia and phosphate.
note on maps below: total for catchment land cover may not be 100% as minor land use categories were not included here for simplicity e.g heathland and woodland.
One possible explanation is a “first flush” effect. Rain falling onto dry sun-baked soils, fields, farm tracks and other surfaces can mobilise nutrients and carry them rapidly into streams through field drains and other drainage pathways. In more normal flows, that pulse may be overwhelmed by dilution or simply miss our monthly test round. In 2026, exceptionally low flows may have made it much easier to detect.
Our data could provide a useful baseline for sustainable farming work in the Mole catchment. A new Sustainable Farming Advisor SFA has been employed to engage with farmers in the Mole catchment. If land-management changes reduce rural nutrient runoff, future RMRW monitoring could help detect whether that improvement appears in the streams themselves.
Continued testing is allowing us to learn more each year about the individual character of each subcatchment. Another huge thank you to our fantastic testing team!
What has summer 2026 revealed?

Summer 2026 gave us an unusually clear view of the Mole under extreme low-flow stress. It raised the importance of our focus on treated-effluent quality and new indications of intermittent pollution in rural catchments. It also maintains our focus on the "usual suspects" - those streams we know to have exceptionally poor water quality.
We will pursue the treated-effluent findings with Thames Water, while continued monitoring will help us assess whether new sustainable farming work reduces nutrient pressure in rural streams. The extraordinary disappearance of the Mole through Norbury, and the fish rescue that followed, will be the subject of another RMRW article soon.
Thank you for reading! Please like, leave comments and share widely!


Comments