

September 2026: Drought Reveals a Changing River Mole
The summer drought has exposed alarming new pollution hotspots, striking differences between tributaries, and an intriguing discovery: the Upper Mole's lowest summer flows appear to have risen by 30% over recent decades.

Our September citizen science testing revealed continuing severe phosphate pollution and some new hotspots. The prolonged summer drought also prompted us to investigate more than 50 years of river flow records, revealing an intriguing finding: the Upper Mole's lowest summer flows appear to have increased, possibly due to rising volumes of treated wastewater.
This raises an important question: is the Mole becoming increasingly dependent on treated effluent during drought, while natural flows from the surrounding catchment struggle? If so, the quality of that effluent matters more than ever for wildlife and people.
1. September dashboard: phosphate stays high, Deanoak stays extreme
September showed continued severe phosphate pressure across the catchment with an overall water quality status of Bad. Average catchment ammonia improved from the very high concentrations last month but some tributaries continued to show extremely high levels.

Phosphate remained a big concern as high concentrations were widespread across the catchment.

Across the Upper Mole main channel, from Horley and Sidlow to the Stepping Stones, September phosphate averaged 1.65 mg/L — higher than in any summer month. The main Upper Mole tributaries averaged 1.20 mg/L, also above their summer levels.
At Gatwick Stream Horley, phosphate reached our Bad water quality class for the first September on record. Only July 2024 has recorded a higher concentration at this site.
These high concentrations are especially concerning when low summer flows provide so little dilution.

Deanoak Brook stays extremely polluted in September
Deanoak Brook, one of the most rural catchments, was again a standout pollution hotspot in September. It has rapidly become on of the most-polluting tributaries in our league table since extreme spikes in ammonia and phosphate emerged in August .

Ammonia concentration in Deanoak Brook was even higher than August!
September results for Deanoak Brook were 2.50 mg/L phosphate, 3.0 mg/L ammonia and 1,553 µS/cm conductivity.

Rain following prolonged dry weather in August suggested a possible "first flush" of pollution from fields and farms. However, September received only half its average rainfall, with no rain in the three days before testing and no preceding storm-overflow activity. This makes a recent first flush a less convincing explanation.
The persistently extreme ammonia and phosphate concentrations now suggest a continuing local pollution source, very poor dilution, or both.
Deanoak remains a top priority for our next sub-catchment investigation.
2. The drought has reshuffled the pollution league table
This summer has produced some of the most dramatic changes we have seen in our pollution league table.
Deanoak Brook moved from 19th in the long-term ranking to the most polluted site in September.
Spencer's Gill moved from 14th to second most polluted, with phosphate at 2.50 mg/L and ammonia rising from 1.10 mg/L in August to 1.70 mg/L in September.
The drought appears to be exposing pollution pressures normally diluted by higher flows, although new local pollution sources may also be contributing. Even normally cleaner streams, including Bewbush Brook, have deteriorated, while the main River Mole at Sidlow Bridge has also fallen sharply in the rankings.

Several of the usual chronic hotspots remain at the bottom of the table in the "most polluted" class. Gatwick Stream Horley, Leigh Brook and West Vale Bridge all stayed towards the most polluted end. Hookwood Common Brook, our worst-ranked site over the longer record, also remained poor, although its extreme August ammonia result improved in September.
On the plus side, Redhill Brook moved in the opposite direction and appears to show significant improvement with reducing pollution concentration. It improved to 6th least polluted in September, compared with 27th in our long-term ranking. More on this story next.
These changes highlight how differently tributaries respond to drought. Streams supported by groundwater from more permeable geology, such as Redhill Brook's predominantly Greensand catchment, appear to have maintained better flows and water quality. In contrast, clay catchment streams such as Gad Brook and Deanoak Brook have more limited groundwater support and have either dried up or experienced rising pollutant concentrations as flows diminished.
The results help identify where future droughts may cause the greatest ecological stress, and where groundwater could provide some protection.
This new data will help identify where pollution pressure may become most severe as climate change brings more extreme heat and droughts — and where groundwater or other sources of flow may be able to help to protect water quality and wildlife.
3. Redhill Brook: is groundwater helping it cope?

Redhill Brook test results improved sharply in September. Phosphate fell from 1.78 mg/L in August to 0.46 mg/L in September. For context, in August it had one of the worst phosphate results in the catchment so it is by no means out of the woods!
Nevertheless, the improvement in September was notable and moved Redhill to the 6th least polluted spot in our monthly ranking. While its overall water quality is still Poor, the long-term phosphate record shows a gradual improvement with lowering phosphate year-on-year, as shown below.
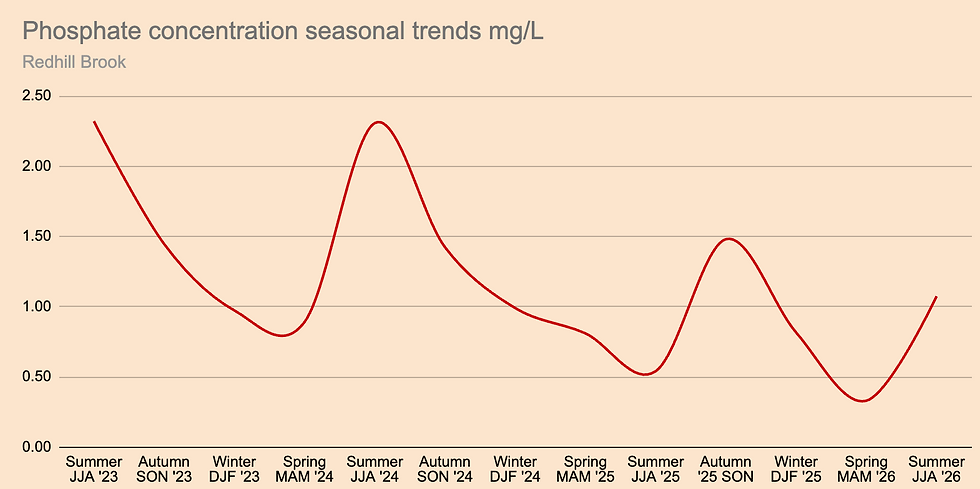
We are discussing this encouraging trend with Thames Water. It could reflect improvements in wastewater treatment at Merstham STW, increased dilution from groundwater, or a combination of both. Further investigation is needed, but if the improvement continues, it will be welcome news. We would also welcome observations from local residents.
Redhill Brook: rising summer stream levels?
Redhill Brook is one of a handful streams in the Mole catchment which is reliably fed by groundwater from its upper catchment of predominantly permeable sandstone geology. It appears to have healthy baseflow even after prolonged drought, contrasting with those streams on the Weald Clay that have more readily fallen to very low flow or dried up completely in recent summers.
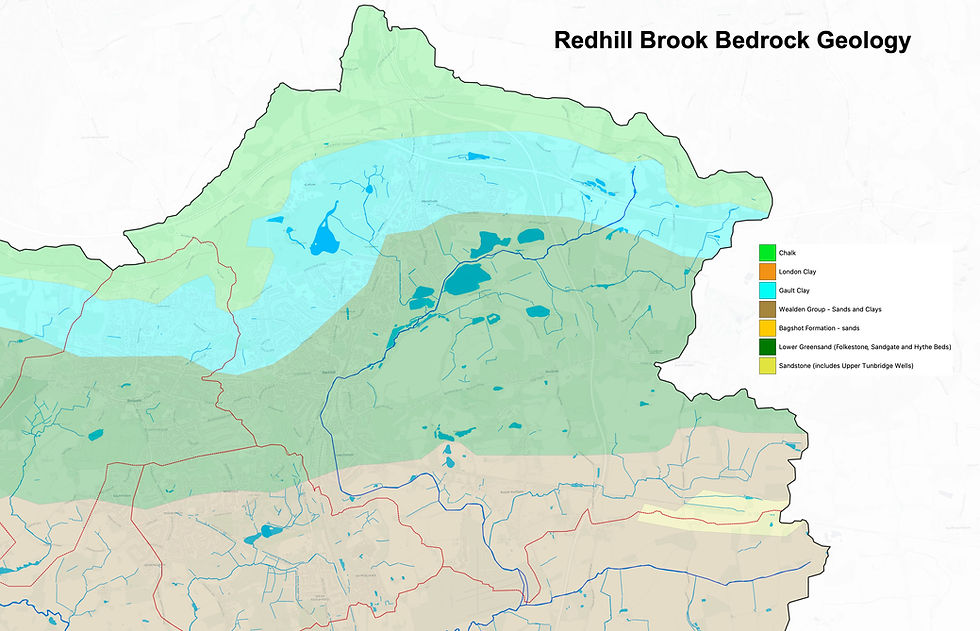
Groundwater conditions in the upper Redhill catchment are known to be changing due to decreased pumping from quarrying and landfill activities. Several sand and fullers earth quarries in the upper parts of Redhill Brook have either shut down or scaled back operations over the years, and the same is true for landfill sites.

Reduced quarry and landfill pumping may be allowing groundwater levels to recover across parts of the upper catchment, including areas feeding Redhill Brook and Warners Brook. Waterlogged fields on The Moors and Nutfield Marshes, together with persistent flooding of the NC21 cycle route, are consistent with rising groundwater, although local drainage and other factors may also contribute.

Rising groundwater could be providing more support to the brook during dry summer weather.. sustaining higher flows and perhaps diluting pollutants. We checked the long Redhill Brook gauge record and found that there is evidence for rising summer levels in the brook.

Gauge records show that between 2016 and 2026, the median summer river level was approximately 16 mm higher, and the lower-stage P10 (10% lowest river levels) was 12 mm higher, than during 2005–2015. This occurred despite average summer rainfall being around 28 mm lower in the later period.
In other words, Redhill Brook has generally maintained slightly higher summer water levels despite drier conditions.
Spring levels also showed some recent uplift of stream level in Redhill Brook. While this is consistent with stronger groundwater support the very driest summers still reached similar low stages as historic data shows, so more work is needed to fully understand the change and where it might go in the future. Nevertheless, initial investigation shows some compelling changes.

Why does this matter? Groundwater support helps explain why some tributaries like Redhill Brook sustain relatively healthy flow during prolonged dry periods while others deteriorate rapidly. This highlights how each tributary in the catchment has unique geology and groundwater characteristics.

Changes to groundwater will become increasingly important as drier, hotter summers and flash droughts place more pressure on streams across the Mole catchment. However, flows of treated (and untreated) wastewater from sewage treatment works have also been changing which complicates things.. this is what we'll look at next.
4. Has the Mole’s summer low-flow regime changed?
The exceptionally low flows this summer, and the Mole's second vanishing episode in four years, prompted us to ask whether the river's summer low-flow regime has changed over the longer term.

We examined more than 50 years of daily flow records from Kinnersley Manor on the Upper Mole and Dorking Castle Mill, 15 km downstream.
To compare broadly similar dry summers, we selected years with June–August rainfall of 125 mm or less and preceding winter and spring rainfall of 300–450 mm. We then examined each summer's lowest sustained seven-day mean flow.

The result was striking: sustained low flows at Kinnersley Manor were approximately 30% higher in recent comparable dry summers than before 2000. At Dorking, however, there was no equivalent increase.
The main increase appears to have occurred between the 1980s and 1990s, with typical low flows rising from around 0.35 m³/s to approximately 0.47–0.50 m³/s. They have remained broadly at this higher level since.

However, at Dorking Castle Mill gauge, there is no equivalent change; if anything, the lowest flows have declined slightly. So there is more research needed to fully explain this data.

We endeavoured to check for changes in operation at each gauge which might explain things. The Environment Agency has confirmed that the same stage–flow rating curve has been used at Kinnersley Manor throughout the record, supporting the interpretation that this is a genuine change in recorded flow rather than a change in gauge calibration. We await formal EA confirmation of the Dorking gauge but we understand it has had no changes either. So the data looks robust enough at least to prompt further investigation into flow patterns.
The key finding is that the Upper Mole's low-flow 'floor' appears to have risen at Kinnersley Manor and that an additional rise in low flow is not shown at Dorking. Why?
Could treated wastewater be part of the reason?
Kinnersley Manor gauge lies just downstream of major sewage treatment works at Crawley, Horley and Burstow. The catchments for these STWs have experienced enormous growth over the past 60 years, particularly Crawley and Horley STWs.
The combined population of Crawley and Horley increased rapidly from approximately 70,000 in 1961 to 144,000 in 2021 — more than doubling. Gatwick Airport expanded even more from fewer than 400,000 annual passengers in 1959 to more than 40 million today. Gatwick wastewater is sent to both Crawley and Horley STWs.

This expansion has greatly increased wastewater-generating activity. Treated wastewater entering the Upper Mole is therefore a strong candidate for explaining rises in the lowest flows recorded during summer, particularly during drought when natural "baseflow" runoff is greatly reduced. We noticed this during the SESW water supply outage this summer when the level of the Upper Mole dropped significantly after just 24 hours of interrupted water suppy through these STWs.
The scale of wastewater treatment is revealing. Current population-equivalent (PE) figures for the major sewage treatment works in this part of the catchment are:
Sewage treatment works | approx Population equivalent |
Upper catchment group | |
Crawley | 143,000 |
Horley | 38,000 |
Burstow | 11,000 |
Total | 191,000 |
Downstream group | |
Reigate | 60,000 |
Merstham | 10,000 |
Holmwood | 6,000 |
Total | 76,000 |
The sewage works upstream of Kinnersley Manor serve approximately 2.5 times the population equivalent of the additional works between Kinnersley and Dorking. Although PE does not directly measure effluent discharge, the contrast highlights the considerable scale of wastewater-generating activity upstream.
Together with the growth in Crawley, Horley and Gatwick, this supports our hypothesis that increasing treated wastewater may have helped raise the Upper Mole's summer low-flow floor.
The scatter charts below show the lowest flow and associated summer rainfall data for Kinnersley Manor and Dorking gauges. Kinnersley Manor clearly shows an increase in lowest summer river flows from 2000 onwards (orange crosses). Dorking gauge, however, does not show a similar increase.
Why hasn't Dorking gauge experienced the same increase in summer lowest flows?
Between Kinnersley and Dorking, the Mole receives water from several tributaries draining predominantly clay catchments, as well as treated wastewater from three additional sewage works. Yet despite these contributions, Dorking shows no equivalent rise in summer low flows.

Population growth around Reigate and Redhill has been much more modest than around Crawley, Horley and Gatwick, suggesting less growth in wastewater-generating activity in this downstream area.

Meanwhile, natural tributaries appear increasingly vulnerable to drought. Gad Brook, Betchworth Brook and Tanners Brook have dried up or stopped flowing in recent summers. Unlike wastewater-supported streams, these clay catchments have limited groundwater reserves to sustain flow during prolonged dry periods.
Our working hypothesis is that increased treated wastewater entering the Upper Mole is being offset further downstream by reduced natural contributions from these tributaries.
In other words, extra water arriving from upstream may simply be replacing flows lost from drought-affected catchments between Kinnersley and Dorking. Other possible influences include abstraction, impoundments and river management structures, including the hydro-power installation at Betchworth Estate.
This remains a hypothesis. We need longer-term tributary flow records and actual sewage treatment works discharge data to test it. Nevertheless, it provides a plausible explanation for the contrasting low-flow trends at the two gauges.
A wider question is also important: does higher summer low flow in the Upper Mole show an increasing dependence on treated wastewater, while natural contributions from the surrounding catchment diminish due to climate change?

Why does this matter?
If treated effluent now makes up a larger share of the Mole's summer flow, its quality matters more than ever.

For wildlife, low natural flows mean less clean water to dilute nutrients and other pollutants discharged from sewage works.
For people, the implications are equally important. At popular places such as Stepping Stones, where families paddle, children play and people swim, a substantial proportion of the water during drought may originate from treated wastewater discharged upstream.
This reinforces the importance of improving the quality of wastewater discharged into our rivers.
The more a river depends on treated effluent to sustain its flow, the more critical the quality of that effluent becomes.
The finding is also important for understanding future river behaviour. Changes in the balance between rainfall, groundwater and treated effluent may alter how the Mole responds to drought.
The Upper Mole at Kinnersley now appears to sustain substantially more water during its lowest summer periods than it did several decades ago. Understanding why should be a priority.
5. What the drought is teaching us about the Mole

This summer's drought has revealed some important new insights into the River Mole catchment.
Our monthly citizen science testing has identified new pollution hotspots, striking differences in how tributaries respond to drought, and evidence of a long-term rise in the Upper Mole's lowest summer flows.
Deanoak Brook and Spencer's Gill have deteriorated sharply, while Redhill Brook has shown improvement, possibly helped by stronger groundwater support. At Kinnersley Manor, higher sustained summer low flows raise important questions about the increasing role of treated wastewater from the growing Crawley, Horley and Gatwick area.
Together, these findings reinforce the importance of understanding where our river water comes from — and improving the quality of the treated wastewater that may increasingly sustain the Mole during drought.
These discoveries have only been possible through regular monitoring by River Mole River Watch's citizen scientists. Without their long-term commitment, many of these changes would have gone unnoticed.
A big thank you to our fantastic team of volunteers who venture out each month to monitor sites across the catchment. Your work is making a real difference!
Please share this article with anyone interested in the River Mole, and let us know your own observations in the comments.


Comments