
River Mole Summer 2025: a near-miss for the River's Health?
- Sep 9, 2025
- 10 min read
Updated: Sep 10, 2025
Findings of River Mole River Watch Citizen Science Summer 2025


Summer 2025 put the River Mole under real pressure. After the driest spring in over a century, June and August brought parched conditions, low flows, and record heatwave days — the kind of cocktail that usually means rising pollution concentration and stressed aquatic life.

However, a larger ecological summer crisis in the river may have been averted thanks to a July that was wetter-than-average (182% of normal) and rain arriving in late August. If drought and heat had persisted we may be telling a different river story.

The bulk of summer rainfall fell in just four episodes of heavy rainfall as shown in the chart below. Surprisingly, these events made only a modest impact on river levels despite heavy rain over a short period, exceeding 40mm on 19 July and over 50mm at Pease Pottage on 29 August. No summer river flooding occurred. The pattern of prolonged dry conditions punctuated with sporadic deluges shaped the condition of the River Mole and its tributaries during summer. Perhaps surprisingly, at 189.8 mm, total rainfall accumulation for summer 2025 was more than summer 2024, which at just 133.2 mm, is the driest of the three summer seasons of river testing so far (2023 186.4 mm). (We access rainfall data for the catchment from Charlwood MetOffice Station and the Burstow, Pease Pottage and Leatherhead EA gauges plus our own VantagePro2 AWS in Reigate amongst other sources).

Our citizen science programme, now with three summers of phosphate data and 18 months of nitrate, ammonia, conductivity and temperature data, shows this season was something of a "near-miss", avoiding the huge spikes in pollution seen in 2024. Overall, water quality remained poor, with systemic nutrient pressures, but July rain and associated cooler weather may have “saved” the river from higher concentration of contaminants which go hand-in-hand with algal blooms, mass fish deaths or severe deoxygenation.

Headline Findings
Phosphate: Catchment mean this summer was 0.82 ppm (2025), slightly lower than 1.08 ppm (2024 and 2023).
But 71.6% of samples were Poor/Bad this summer, compared with 63% last year with 74% in 2023.
Overall, 80% of water courses still fail water quality standards (Moderate-Poor-Bad).

Histogram showing phosphate test distribution
Nitrate: Very similar catchment averages both summers: 21.5 ppm (2025) vs. 27.8 ppm (2024).
Around 50% of samples are Poor/Bad in both years.
Ammonia: Slightly higher catchment average 0.36 ppm (2025) vs. 0.29 ppm (2024).
Most water courses show low ammonia concentration.
Ammonia outliers highlight a few problem streams such as Hookwood Common Brook, Leigh Brook and Wallace Brook.
Record spikes occurred this summer at Hookwood Common Brook reaching 5 ppm (toxic), compared with 3 ppm last year.
Conductivity & Temperature: Elevated during dry June/August, reflecting concentrated pollutants and warmer waters.
Phosphate
Despite a slight dip in average concentration this summer, over 70% of phosphate results were still classed as Poor or Bad — confirming phosphate remains the Mole’s most persistent and widespread pollutant.

Our longest dataset continues to show a worrying pattern of high summer phosphate concentration when river levels fall low. While summer 2025 mean phosphate concentration across the catchment was lower than 2024 and 2023, more than 70% of tests still fell into the Poor or Bad water quality classes. This is similar to Summer 2023 but more than Summer 2024 (63%). This suggests chronic nutrient pressures remain widespread despite some annual variability.
“80% of watercourses in the River Mole catchment still fail water quality standards.”

As has been the case each summer, streams hosting sewage works faired the worst in terms of phosphate concentration during summer 2025.
Phosphate hotspots remain concentrated around streams with sewage works upstream.

The chart below shows the seasonal trend in phosphate concentration for all tributaries. These are colour-coded to show overall water quality status according to Water Framework Directive guidance. Those in red are streams falling into the worst water quality categories, Poor and Bad. This includes Leigh Brook, Burstow Stream, Salfords Stream and Redhill Brook. All host major sewage works upstream. The exception is Hookwood Common Brook which hosts a small package treatment plant.

Least polluted streams, those achieving Good or High water quality, as usual appear in the upper reaches of tributaries nearer to the watershed including Pipp Brook and Upper Burstow Stream as well as Ifield Brook, Bewbush Brook and Shag Brook. These host no major sewage assets upstream.

Concerning the main River Mole channel itself, our test sites on the Upper Mole and Lower Mole both experienced markedly lower spikes of pollution this summer compared with 2024. Indeed, comparing all three years, summer 2024 appears to be a notably "Bad" season regarding phosphate concentration, perhaps not surprising given it was the driest summer, although it lacked the super-dry spring of 2025.

A closer view of the Upper Mole basin below shows the most polluting subcatchments. Each circle at a site represents one summer month, JJA. Different sized circles being visible for the same test site indicates a wider variation in concentration month-to-month.

The Lower Mole has also experienced lower summer phosphate peaks this year compared with 2024. It's usual for the Lower Mole to experience lower phosphate concentration than the Upper Mole in summer. This pattern is reversed in winter.

The map below shows phosphate concentration through the Mole Gap and into the Lower Mole. Note the more consistent levels of phosphate shown by similar sized circles at each site.

The majority of streams across the whole catchment have consistent test results during summer months and similar results across different years, illustrated in the chart below. This builds a unique "fingerprint" of pollution for each water course. In instances where test results stray significantly away from the normal for a particular stream, we take steps to cross-check anomalies and assure data quality by verifying the results.

The result is we are confident that our data is robust from month to month and year to year.

Furthermore, where a stream appears to be behaving particularly badly we arrange survey days with the EA (Environment Agency) and SERT (South East Rivers Trust) where we focus together on testing a single catchment. This is to both verify our data and explore possible causes of pollution.


A recent example is Hookwood Common Brook where we found exceptional surges in phosphate and ammonia starting this March and continuing through summer.

Further high resolution testing of the brook pointed us towards a specific point source of pollution. We covered this in a previous post where you can read the detailed account.

On a more positive note, there is a welcome trend of reduced phosphate contamination in Earlswood Brook south of Reigate. During summer, this small stream receives a significant proportion of flow from treated effluent discharge at Earlswood sewage treatment works in Reigate. Our test results from Earlswood Brook show two striking patterns: a steady summer-on-summer reduction in phosphate, and an unusual spring peak unlike any other stream in the catchment (most peak in summer).
“Earlswood Brook stands out with both a spring peak and an overall improving trend.”

We are consulting with Thames Water to understand why water quality is improving in Earlswood Brook. Our current assumption is that chemicals like ferric salts are added at the treatment works to the wastewater to bind with phosphate, allowing it to settle before release. The dosing amount is adjusted throughout the year to ensure the plant remains within its annual phosphate limits. Since the compliance period begins in spring, dosing rates might be lower early in the season due to expected dilution during wetter seasons, with increases later to balance the average. This, along with variations in rainfall and river flow, might explain why phosphate levels in Earlswood Brook have tended to peak in spring rather than summer. The overall downward trend in levels could be a positive sign of improved processing decisions at the plant. We are requesting Thames Water to clarify this and potentially replicate it at other treatment works with phosphate treatment on vulnerable tributary streams like Redhill Brook, Leigh Brook, and Burstow Stream.

Overall, 80% of water courses in the River Mole catchment still fail water quality standards.
Ammonia
Toxic ammonia spikes reached 5 ppm at Hookwood Common Brook this summer — the highest yet recorded — while most other sites stayed low. Extreme test results allow us to identify problem streams.
Throughout this summer, as is usually the case, background ammonia levels in most streams across the catchment were generally low. As normal, ammonia levels decrease downstream because of biological activity and the chemical conversion into other nitrogen compounds.

However, summer 2025 brought severe spikes in ammonia to certain catchments. As already mentioned, our tests revealed that Hookwood Common Brook in particular was heavily impacted by toxic levels of ammonia, reaching 5 ppm in the July test — a level toxic to fish and invertebrates. The surge in ammonia concentration in this brook started suddenly in March and remained elevated throughout summer. Our previous post explores the catastrophic failure of permitting associated with this damaging pollution.

Wallace Brook (1.85 ppm July) and Leigh Brook (3 ppm August) also experienced extreme ammonia levels and investigations are ongoing to understand levels on these streams.


These extreme outliers raised the overall mean which exceeded summer 2024, showing how a handful of pollution events can shift catchment averages.


Nitrate
Half of all samples again fell into Poor or Bad water quality for nitrate, echoing 2024 — showing this pollutant remains a chronic, entrenched problem in the Mole particularly through the vulnerable chalk Mole Gap.
Nitrate pollution follows a similar seasonal surge in summer as phosphate. Nitrate levels are raised in the main channel and are a particular problem in the main River Mole through the chalk Mole Gap. Nitrate appears to be just as sensitive as phosphate to rainfall and increased river discharge and dilution. Heavy rain the day before testing in late August had an immediate impact on nitrate levels.

Higher river flow resulted in lower August nitrate concentration across the catchment.

Despite the wet August test, this summer's average nitrate concentration in the catchment was 21.5 ppm, nearly matching last year's 27.8 ppm, with approximately half of the samples falling into the Poor or Bad categories both years. Although most tributaries showed low nitrate levels, several stream test sites reported extreme values exceeding 50 ppm.
All of these sites are located downstream of sewage treatment facilities, including Earlswood Brook, Burstow Stream, and Leigh Brook.

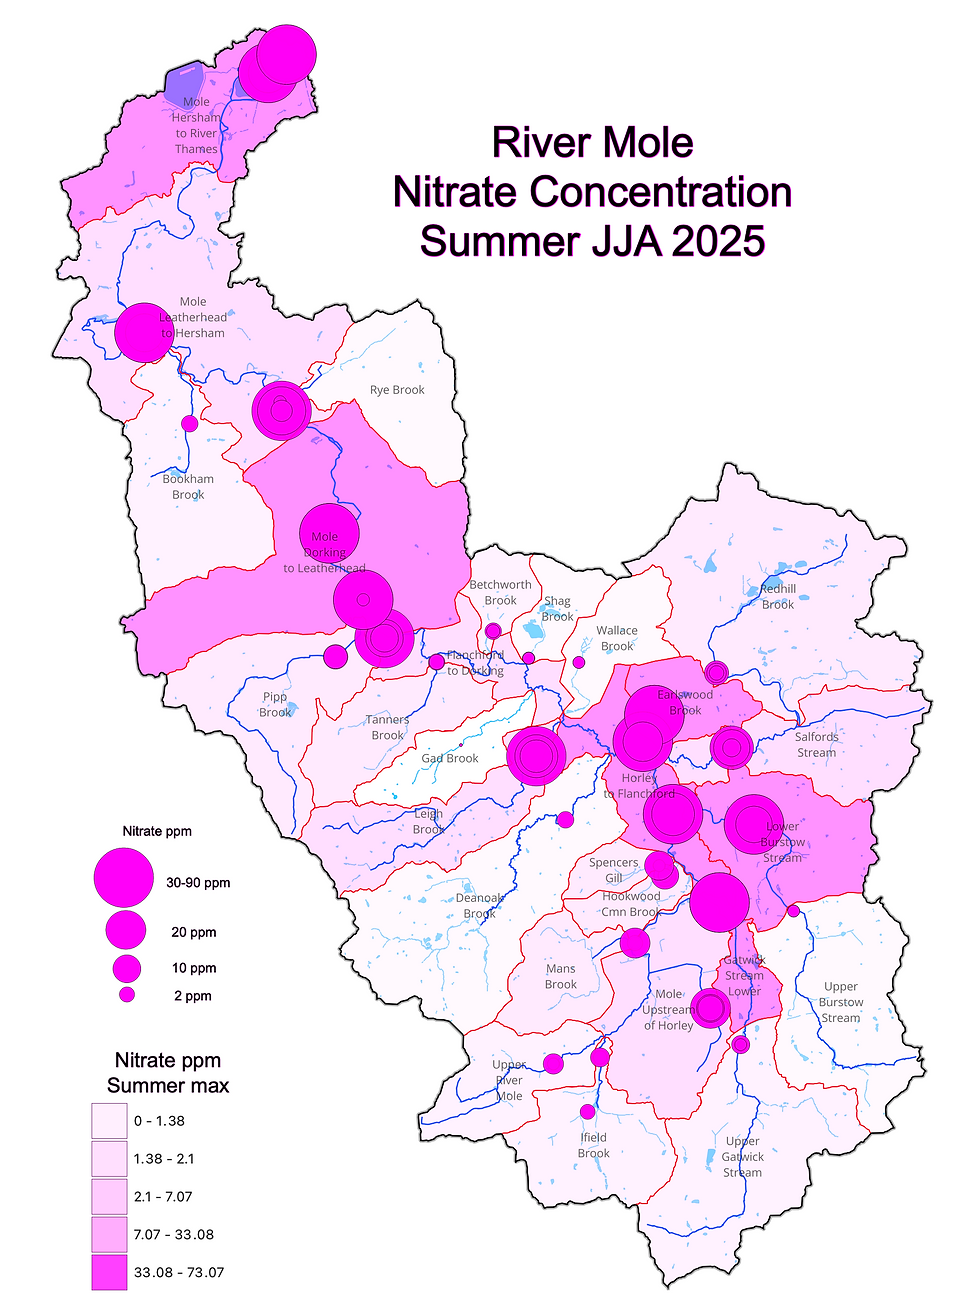
Furthermore, every test site along the length of the main river channel from Horley downstream to the Mole Gap recorded elevated tests in excess of 50 ppm through the summer. Overall long term averages are over 30 ppm in the lower course. Elevated nitrate in the chalk gap is concerning because it is here that river water drains into the chalk through swallow holes.

Conductivity & Temperature
River temperatures peaked above 21 °C in June — stressful for fish and invertebrates — before July’s rainfall briefly brought relief
Low flows in June and August led to higher conductivity, indicating more concentrated pollutants. Water temperatures rose too, reaching their highest in June at 21C average catchment temperature. Higher temperatures stress vulnerable ecosystems and local angling groups in Dorking considered closing their fisheries if temperatures continued over 20C . The wet July provided respite and improved conditions, a reminder of how dependent river health is on how the weather turns out in terms of temperature as well as rainfall and dilution.

Storm Overflows
191 hours of storm overflow occurred in summer 2025, over 142 hours of which were triggered by just two of the heaviest rainfall events on 19 July and 29 August.

Storm overflow discharges were limited this summer — but heavy July and August storms still triggered short, sharp sewage discharge pulses.
With prolonged spells of dry weather, storm overflow sewage discharges were less frequent and shorter duration this summer except during the heavy rain episodes in particular on 19 July and 29 August when over 40mm fell in 6-7 hours. In total 191 hours of storm overflows occurred over the three months June, July and August. Over 75% of total storm overflows duration occurred as a result of the two heaviest rainfall events on 19 July and 29 August.
Heavy rain falling around a sub-catchment will trigger storm overflows within hours, usually starting when totals accumulate over 10mm and certainly in excess of 20mm. Reactive assets which respond quickly to rainfall include Charlwood CSO, Millbank CSO in Crawley, Holmwood STW, Horley STW, Ealrswood STW and Burstow STW.


Notably there were few recorded storm overflows at Dorking STW (4 hours) and none at all at Esher STW (0 hours) this summer. The heaviest rain fell mostly in the Upper Mole and spared these sites. Horley STW was offline through much of August due to emergency engineering works designed to stop sewage flooding out of the works and into properties. We can confirm that storm overflows were, however, active during the August storm event but that no sewage flooding was reported.

Why Testing Matters
Phosphate & Nitrate → drive algal growth and oxygen crashes.
Ammonia → directly toxic, even at short-lived peaks.
Warm, low-flow summers → magnify these pressures.
Our exceptional citizen science monitoring program continues to reveal pollution patterns and extreme spikes in certain streams throughout the catchment area. By comparing data across three years, we can identify not just isolated instances of pollution but ongoing systemic problems. Our data is gaining increasing recognition and respect from stakeholders, and we are utilising it to drive action in the areas that require it the most.
An enormous thanks to our outstanding citizen science volunteer team.
Our monitoring shows the Mole remains under pressure. This summer was a near-miss — a wetter July may have spared the river worse damage. But damaging nutrient pollution continues. Please support our citizen science effort and add your voice for a cleaner Mole.
Thank you for reading! Please like and share widely to support our work and spread the word. Please leave a comment.


Comments