
September River Mole test results: the solution to (hiding) pollution is dilution
- Oct 8, 2024
- 10 min read
Updated: Apr 24, 2025
In this month's review, we examine the early start to seasonal improvements in pollution across the catchment due to dilution from record breaking rainfall causing higher river levels. We then delve into the huge duration of sewage overflows triggered by the heavy rainfall. Additionally, we analyse some early comparisons of pollution levels upstream and downstream of key pollution sites such as sewage treatment works and highway runoff outfalls.

Please hit "like" and leave a comment if you enjoy our work. Please also consider clicking that Donate button if you appreciate the hard work our charity is doing to improve the River Mole for wildlife and people: we need test kits and reagent to keep going plus boring things like website subs and insurance to pay. All donations enormously welcome and appreciated. We are all volunteers from Citizen Scientists to Trustees. Thank you :-)

River Mole River Watch September citizen science tests returned results that show the impact of the wettest September on record for the catchment. This is the wettest month by far that we have recorded during nearly two years of testing. Charlwood official weather station recorded 196mm of rain for September (LTA 52mm) with a run of wet days preceding our test weekend on 28-29 September. Notably, overnight on 22 September recorded a huge 50mm of rain in places such as Reigate and 40mm quite widespread through the Upper Mole catchment. This is a 25 year return period rain event which was from the same prolonged heavy rain that caused severe flooding in the Midlands. We were fortunate here in East Surrey not to get a similar 100 year rain event.

The heavy rain the week before testing caused flood peaks to reach over 10m3/s in the Upper Mole and over 37m3/s in the Lower Mole from Leatherhead to Esher. These initiated EA flood alerts. The intensity of some of the rain would have caused much higher flooding were it to have happened later in winter with saturated soils and leafless trees. Whilst levels dropped for the test weekend many parts of the river were nevertheless still near bankfull stage.

The flow of the River Mole through Leatherhead for the September 2023 test weekend was much lower at 1.8m3/s compared to over 10m3/s for 2024. The result of this increased volume of water meant lower concentration readings across the catchment due to dilution. Whilst September 2023 recorded an average catchment phosphate concentration of 0.79 ppm, September 2024 recorded 0.52 ppm as an average for the whole catchment. Whilst lower, this still falls into the "Poor" WFD category. The other tests also recorded a fall in concentration levels below the running mean for all 17 months of testing so far.

The increased river flow and dilution caused about half the test sites to jump up a whole WFD category. This was especially the case in the Upper Mole where the main tributaries, Gatwick Stream, Upper Mole, Salfords Stream and Burstow Stream, all improved by one WFD category, with the average for this group improving from Poor 1.43ppm in August to Moderate 0.49ppm in September.


Several small tributaries including ones that have unusually erratic or poor records of behaviour, also improved markedly, for example, Hookwood Common Brook improved from Bad in August to Poor in September and Spencers Gill from Poor 1.61ppm to Moderate 0.38ppm. Even Leigh Brook improved to 1.14ppm, breaking a continuous run of 2.50ppm results since March '24.

A significant improvement was also seen at Burstow Stream where even downstream of the STW an improvement was recorded from Poor 2.17ppm in August to Moderate 0.38ppm in September. With generally lower levels of pollution the impacts of pollution from known sources may be muted. However, a series of follow-up tests with the EA and SERT supported our findings regarding the impact of Burstow STW on water quality, more on this below.

On a positive note, the entire main river channel from West Vale in Horley, through Sidlow to Castle Mill in Dorking recorded a modest improvement from Poor in August to Moderate in September, with phosphate levels falling to just below 0.5ppm. In the previous Autumn to Winter period this now-expected seasonal improvement only occurred after the very rainy February.
However, come the rain cometh the sewage...!

With so much rainfall in September the duration of untreated sewage storm overflows into the river jumped markedly from August. 1371 hours of storm overflows were recorded during September compared to just 35 hours in the whole of August. Sewage overflows for September are shown in pink below.

The worst offending treatment works are also the largest: Horley 255hrs, Burstow 191hrs, Leatherhead 126hrs, Dorking 123hrs, Earlswood 119hrs and Holmwood 119hrs: these caused the accumulated sewage overflow duration in September '24 to far exceed the 175 hours for the whole catchment in September 2023. This resulted in the phosphate load transported by the river in September to be the third highest in the 17 months of recording at 19.5kg/h shown by the red star on the chart below.

Water quality is shown to be consistently poorer on streams with sewage treatment works compared to those without. The chart below shows the gap is especially wide in low flow conditions during summer. The gap closed markedly this September. This is due to dilution of the treated effluent and any untreated storm overflows discharged into river during high flow.

Whilst September saw no sites recording Bad water quality, the usual worst offenders still scored levels of concentration well into the Poor WQ category despite increased dilution. e.g. Leigh Brook and Redhill brook. Of greater concern is the whole length of the Lower Mole from the Stepping Stones near Dorking to Molesey continued to reside in the Poor WQ category. This stretch of river has remained consistently Poor for the whole 17 months of testing except one Moderate month in March '24.

In a reversal of usual patterns, the map above shows how the main River Mole channel, especially downstream, is returning higher phosphate levels than many of the tributaries. Low flow in Summer usually sees the opposite of this pattern where tributaries return the worst water quality while there is some recovery in the main channel, presumably due to dilution.
The busy chart below shows this subtle pattern to eagle eyed observers.. blue colours show winter results in the main channel increasing somewhat downstream in relative contrast to yellow/red/orange summer levels which are highest in the tributaries such as Leigh Brook and decrease downstream to the confluence with the Thames on the right hand side of the chart.

This pattern is concerning in light of the higher levels of dilution. The pattern of higher pollution results downstream in the main channel is shown even more strongly in our nitrate test results seen below. These results show the main channel falling into the Bad nitrate category from as far upstream as Horley Riverside all the way to the confluence of the Thames at Molesey. In contrast, several upstream tributaries return good to moderate nitrate levels.

Only three sites recorded a significantly worse result in September than August. Bewbush Brook, which averages 0.66 ppm the highest water quality category in the catchment, fell to 0.2 ppm Good; while Ifield Brook which averages 0.15 ppm Good, fell to 0.25 ppm Moderate. Bewbush Brook is particularly interesting because it has consistently tested High since September 2023, one of the "cleanest" water qualities in the catchment. So a relative deterioration in the wettest month is cause for attention.


Similarly, Betchworth Brook, Moderate in August, deteriorated to Poor in September. All other sites recorded improvement in water quality during this wet month, albeit overall not sufficient to raise the overall catchment water quality beyond Poor. The running mean shows 80% of tests record Moderate-Poor or Bad which is where it has been since April 2024.

The frequency of tests falling into each category is shown in the histogram below. This shows that out of 526 phosphate tests carried out by our citizen scientists so far across the catchment, 420 have returned results showing unacceptable water quality in the Moderate-Poor to Bad categories. The WFD target to raise rivers to "Good" seems sadly a long way off for the River Mole.

Downstream trends for September are shown by the green stars in the chart below. This shows the seasonal pattern change we have already noted whereby the Lower Mole starts to see relatively worse water quality than the Upper Mole in winter / high flow. In Summer it is the opposite...the Upper Mole and tributaries experience significantly worse water quality than the Lower Mole. Reasons for this seasonal change in relative levels of pollution between Upper Mole tributaries and Lower Mole main channel are interesting to consider especially if data this winter shows this pattern continue to strengthen.

A more detailed look at the Upper Mole shows an impressive fall in phosphate levels in the wet September in the main channel from Horley to Fetcham.

There is some overlap here with the inclusion of the Stepping Stones in both charts but the Lower Mole shows similar trends over time with the now familiar lowest water quality obvious in Summer and the more muted improvement in WQ compared with the Upper Mole in winter.

During autumn and winter the Lower Mole seems to experience higher levels of pollution than the Upper Mole. In Summer it appears to be the reverse. These are tentative observations of course, more data is needed to see if this holds up before we can really look for causes but the trends are intriguing.
Phosphate ppm | JJA '23 | SON '23 | DJF '23 | MAM '24 | JJA '24 |
Upper Mole | 1.34 | 0.73 | 0.53 | 0.94 | 1.83 |
Lower Mole | 1.02 | 0.84 | 0.57 | 0.75 | 1.27 |
Comparing the same month each year also raises interesting questions... below are charts comparing results for the same month in '23 and '24. The large scatter of dots in July and August suggest the similarity between data is very weak in the dry summer months with little agreement between test results taken in 2023 and 2024 especially in July. In contrast, in September, despite markedly different rainfall levels between '23 (43.2mm below average) and '24 (172.2mm record breaking), there is more significant correlation between test data. Ideas very welcome in the comments below to offer explanations!

Pollution Levels Up and Downstream of Sewage Treatment Works and Motorways
Below are several charts looking specifically at results upstream and downstream of point pollution sites such as sewage treatment works and motorways. In each case the blue columns show results from a test site upstream while the red columns show results from the nearest test site downstream. These are from our monthly test results so rather coarse in terms of time and sometimes not ideally placed close enough to the point source. Despite these caveats let's see if any patterns appear:
Burstow Sewage Treatment Works: Up/Downstream


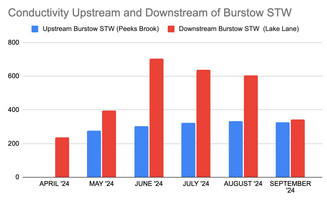


On Burstow Stream, the test sites at Peeks Brook and Lake Lane are 2.5km up and 1.5km downstream respectively from Burstow sewage treatment works. The results above are therefore significant in as much they show big differences in water quality from our monthly tests. While Peeks Brook averages Good WQ it regularly returns High WQ status while Lake Lane, downstream of the sewage treatment works outfalls averages Poor WQ and has fallen to Bad for several months in 2023 during low flow.
A more recent test conducted on 23 September in partnership with the EA and SERT revealed more detailed results up and downstream from the STW shown above. The sites chosen were closer to the STW, both sites were 700 meters from the STW. As the river at the time was high, these can be considered baseline figures because of high levels of dilution. Despite dilution the results clearly show the impact of effluent discharge at Burstow Sewage Treatment Works. The tests conducted at the treated outfall show reasonable phosphate levels given that this was treated effluent direct at the outfall prior to reaching the river.


M25: Up/Downstream

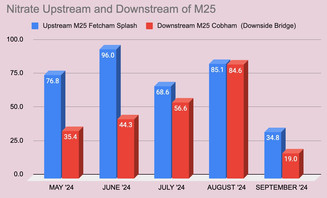


Fetcham Splash test site is 1.8km upstream of the M25 road outfalls while Cobham Downside Bridge is 4.6km downstream of the M25 highway outfalls. There are several High Risk road outfalls from the M25 that enter the River Mole. Whilst there is a tentative suggestion of raised conductivity levels in Cobham, our test sites are probably too distant to pick up the localised impacts reliably. Impacts from road runoff are known to be highly weather dependent. Jo Bradley of Storm Water Shepherds recommends testing after heavy rain and close to the outfalls. Our monthly tests are probably too coarse to spot any impact from road runoff. However, we are planning a focus on highway runoff as another project this winter.
Dorking Sewage Treatment Works: Up/Downstream

The upstream test site at Castle Mill is 500m from the sewage outfall while the Stepping Stones are 1km downstream of the outfall. The results show a slight deterioration in water quality from our monthly tests especially in the first 8 months or so of testing. The average for each site turn out quite similar at 1.05ppm Castle Mill and 1.10ppm at the Stepping Stones. Despite several months where the signal is stronger there isn't sufficient evidence to suggest a notable deterioration downstream of Dorking sewage works from phosphate data for these monthly intervals.

Nitrate data shows a strong and consistent increase in nitrate levels downstream of Dorking STWs at the Stepping Stones compared to upstream at Castle Mill. Ammonia shows no significant difference and data for conductivity is not consistent. Students from University of Reading have been testing locations on this stretch all summer and we greatly look forward to their high resolution weekly test results being published soon.
Comparing the Ember Loop and Lower Mole at Molesey

The Lower Mole divides at Esher STW to form the Ember Loop flood alleviation channel and the River Mole itself which flows north of Island Barn Reservoir. There is one test site on each stretch before it discharges into the Thames. The comparison of phosphate results shows the Lower Mole has somewhat higher levels of concentration through much of the yearly cycle with anomalies in April and September '24. My understanding is that Esher STW discharges mostly into the Ember loop which confounds the idea that higher readings in the River Mole might be explained by effluent discharge. Other factors, such as flow, itself complicated by sluice operations in this part of the Mole, must be considered. The Ember Loop has considerably more discharge than the Mole so dilution may play a part in these results.

That's it for this month... a review of test results from the wettest September in record followed by a round-up of comparisons up and downstream of known pollution sites.
I hope you enjoyed this summary of our September results. Please click "Like" and do leave a comment .. it helps to think people might be findging these musings helpful. If you like our work please consider hitting the Donate button!


Comments