Rising pollution in the River Mole through early Summer, our tests reveal
- Jul 23, 2024
- 9 min read
Updated: Apr 24, 2025
Our water quality test results on the River Mole for June across the catchment show a disturbingly marked increase in levels of pollution. Every chemical test of water quality and other tests such as temperature and conductivity that we measure showed a marked deterioration in June. It has been a super-busy month so this is necessarily a summary of our work. Please do get in touch if you want to find out more or would like to get involved as a citizen scientist. If you like the sound of our work please consider donating using the buttons somewhere on this site or contact us if you cant find them! Thank you.
(Please note we are fully involved with monitoring impacts of the A24 diesel spill on the river and clean-up. Our volunteers have been fantastic in checking and testing the river for any signs of pollution. This post is about June tests which precede the event. Things were bad before the diesel spill so we wait with worrying anticipation for our upcoming July test this weekend to see what will happen with results this time. If you are out and about come and say hello!)

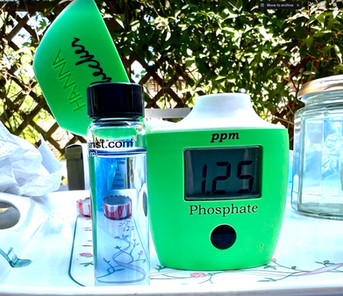
The June catchment average phosphate result of 1.07ppm is well into the Poor water quality range (see table below). At 30.8ppm the score for nitrate is even worse as it falls into the Bad water quality status.

We are working on ammonia thresholds for our catchment, more tests data is needed before we publish these. Needless to say the combined results together are worrying. They all show a marked deterioration in water quality across the catchment. However, the increase in pollution was expected as summer low flow increases the concentration of pollutants due to less rainfall, more evaporation and more transpiration lowering the amount of water entering rivers.

These factors combine to increase the concentration of pollutants as shown by the chart below showing phosphate and river levels from May 2023 to our latest results in June 2024. There is a clear pattern emerging of high pollution concentration in summer and lower concentrations in winter with higher river flows diluting nutrient content. You can clearly see phosphate levels rising at the end of the chart in June 2024 shown by the red line while the blue line of river discharge falls away.

The scatter graph below shows average catchment phosphate concentration against discharge for each month showing how discharge and concentration are inversely related. In short, low river flow increases pollution levels. However, as this is important to river health let's quickly look at what our data looks like on concentration and load and how they relate to river flow and also storm overflows.

The actual pollution load carried by the River Mole in kilograms per hour is less in low flow conditions in summer than in high flow conditions in winter. So the same chart showing phosphate load (kg/hour) looks very different. Here June 2024 is shown as moving only low loads of phosphate while October, a wet month, is shown moving a high quantity of phosphate. This makes sense. But which is more damaging to wildlife? I'm not an ecologist but our thinking is that it is low flow and high concentrations of pollutants in summer that is most damaging to aquatic wildlife.

Things get a bit more complicated when we look at Storm Overflows (duration of sewage spills from the nine big sewage works and numerous pumping stations in the catchment). The chart on the left below shows duration of spills preceding monthly tests negatively correlated with phosphate concentration. So more spills, less phosphate in the river which seems wrong. However, this result relates to the high river flows that cause storm overflows (sewage spills) and thus lower the concentration so it looks like an unexpected result but can be explained in this way.

The chart above right shows duration of sewage spills and phosphate load carried by the river in kilograms per hour. The weak positive correlation looks more in line with expectations. As spill duration increases so phosphate load increases too. The most damaging to river wildlife is almost certainly concentration so that's what we at River Mole River Watch tend to focus on most of all and that is why summer low flow is such as insidious problem for the river.

Right, back to looking at June data...
Pollution levels are not the same everywhere and there are some interesting patterns which continue to emerge strongly. The distinct hot spots in the Upper Mole are very obvious in June results. These hot spots were not restricted to tributaries but also evident in the main river channel which is unusual given the dilution effect usually expected once tributaries discharge into the river and reduce concentrations.

Distinct geographic zones are emerging in the June spread of results shown in the GIS map above:
"Clear Blue Crawley"! lowest pollution levels in the catchment
Starting upstream around Crawley most streams are testing significantly lower pollution levels compared with downstream. These comparatively "clear blue" water courses are shown above in a blue colour with small circles for phosphate results. There are notably low phosphate levels at Bewbush Brook 0.02ppm, Gatwick Stream Grattons Park 0.1ppm and Burstow Peeks Brook 0ppm ..all in the Good class of water quality with Man's Brook 0.31ppm, Ifield Brook and Baldhorns Brook at 0.5ppm in the moderate water quality class.
Upper Mole Pollution Cluster: highest levels of pollution in the catchment
Immediately downstream of Crawley, we can see an obvious cluster of very badly behaving streams in the mid-Upper Mole area around Hookwood, Horley, Salfords, Reigate, Redhill, Leigh and towards Dorking. The large red blobs of high June phosphate test results include the usual tributaries such as Hookwood and Leigh Brooks and Earlswood Brook but also more worryingly stretches of the main River Mole channel at West Vale bridge and Sidlow Bridge. All of these were classed as Poor or Bad. Burstow Stream and Redhill Brook also tested Poor.

One possible explanation for the sudden jump in pollution in the Upper Mole might be treated or untreated discharges from the large sewage treatment works located downstream of Crawley and Horley on the River Mole, Gatwick Stream and Burstow Stream. The charts above showing trends in phosphate concentration over the year do show a significant difference in phosphate concentration between those tributaries with STWs and those without.

Furthermore, the "Upper Mole Pollution Cluster" is turning out to be a persistent summer feature as shown by the chart above.
Mole Gap Group : Dorking to Leatherhead: poor water quality
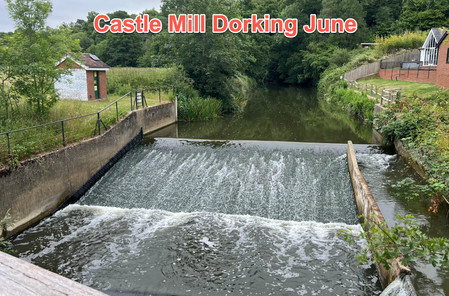
Continuing downstream there is a similar "Mole Gap Group" of poor water quality as the river passes from the Weald clay basin at Castle Mill Dorking and into the chalk gap Swanworth Farm. This is a fascinating and critical area for research into how the various flows into and out of the chalk groundwater affect river flow and water quality.

We have been very fortunate this year to have University of Reading students studying the river in great detail this summer in partnership with us at RMRW. We won't preempt any findings of their studies here just yet but it involves the outfall at Pixham STW and how that impacts all the parameters of phosphate, nitrate and ammonia up and downstream that we are studying across catchment. The findings will be very interesting. It has been a delight working with the students.
Further downstream June phosphate levels fall somewhat to around 1ppm or just below but remain in Poor water quality status through the Lower Mole.

Overall the River Mole remains in unacceptable status with 87.5% of our water courses being in moderate poor or bad status in June. All of the water courses achieving High water quality status are found in the Upper Mole and are mostly first order tributaries and none have sewage treatment works or pumping stations upstream of test sites. Notably there were no test sites in the Good status category in June.

The frequency histogram above shows that 79% of water courses tested by our citizen science volunteers over the last 13 months have mostly fallen into the moderate, poor or bad water quality status. The running mean (long term average) of all results across the catchment over the last 13 months shows that over 78% of water courses are in unacceptable condition.

Nitrate results
Our nitrate tests show a similar Geographic pattern to phosphate. It's too early to comment on any seasonal trends as we have only been testing nitrate for a few months.

Nitrate results shown on the map above are more volatile across the catchment than phosphate with a higher range of possible results. In our tests for June across all 34 sites the concentration of nitrate ranged from 0ppm to 93.8ppm. Less than 1.2ppm was recorded at 10 sites while over 75ppm was recorded at 8 sites.
A somewhat similar geographic summer pattern is emerging to phosphate with a "Clear Blue Crawley" group of mostly lower nitrate levels found in smaller streams within and south of the town and a strong hot spot of high levels of nitrate pollution in an "Upper Mole Cluster". Of note however is that these high nitrate levels are maintained and even increase through the Mole Gap and only start to decline further downstream into the Lower Mole.

The chart above further highlights some key differences in nitrate trends compared to phosphate downstream which emerged even just over the first few months of testing. Importantly, there appears to be an increase in nitrate concentration through the Mole Gap from Castle Mill in Dorking to Swanworth Farm and even as far as Fetcham Splash. This was present somewhat in May but has strengthened further in June at least as far as Swanworth Farm. The darker red columns from Castle Mill downstream increase high levels through the Mole Gap from 73ppm at Dorking to 90ppm at Swanworth Farm. This is a significant finding, albeit very early days in terms of our testing regime, because nitrate is seen as a risk to groundwater contamination in the local chalk aquifer from which we abstract our drinking water and a high concentration in surface waters is clearly not a welcome indication.
The chart above also shows emerging trends in the form of large red spikes of nitrate concentration in the Upper Mole on the Earlswood Brook, Burstow Stream and Leigh Brook as well as Gatwick Stream at Horley. Some of these accompany pink spikes from May showing evidence of a potential nitrate problem on these streams. All of these test sites are downstream of sewage treatment works.

The chart below supports the proposition that nitrate concentration is sensitive to the presence of upstream sewage treatment works. It shows tributaries with and without STWs. The trend lines speak for themselves and it will be interesting to watch over the coming months.
We are delighted and excited to be working with SESW on collecting nitrate data who are partnering us on our nitrate testing programme as part of their two year long research programme into groundwater nitrate pollution. We are excited to have their support and delighted to be providing them with data to assist research.

Overall results for nitrate across the catchment show a mixed picture. 33% of tested water courses fall in the High water quality status and these are mostly in the upper reaches of the catchment south of Crawley on streams such Bewbush Brook and also first order streams flowing from chalk such as Wallace and Shag Brooks near Reigate. Surprising results also emerge such as Hookwood Brook which scores so high in phosphate but happily only 0.8ppm in nitrate. However, this leaves over 60% of water courses falling into the moderate poor or bad categories and significantly nearly 50% of these are in the worst category which is Bad.
A new GIS resource from Watershed Investigations
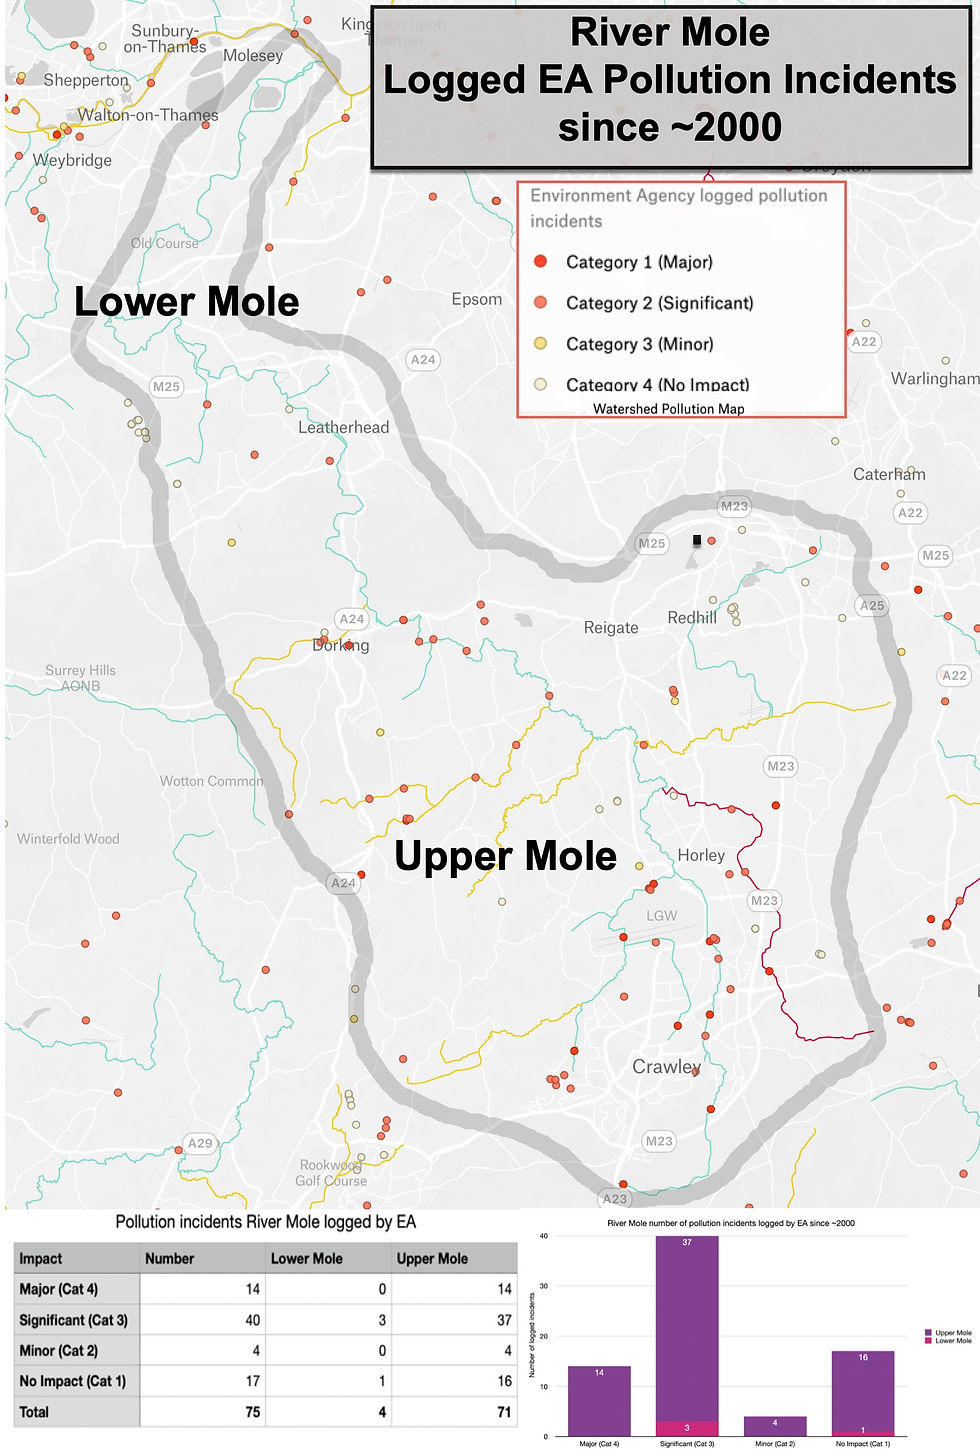
The map below is taken from a fantastic new resource by our friends at Watershed Investigations who have created this excellent new GIS for investigating river pollution. The layer I've selected to show is the number of pollution incidents in the Mole catchment since 2000. The results, while not related directly to June test results, do show how the distribution of incidents are skewed to the Upper Mole with 71 out 75 logged incidents occurring in this upper part of the catchment which we are finding is most vulnerable to nitrate and phosphate pollution.

Update on Storm Overflows to June 2024

The total duration of storm overflows in the catchment for June was the lowest recorded at a mere 2 hours occurring at Pease Pottage pumping station for 1 hour on 9 June and 30 minute each 24 and 25 June. Total June rainfall for the catchment was 20mm which is 39% of the long term average total for the month so storm overflows should be minimal. The total duration of untreated sewage overflows for 2024 are 8408 hours for the Mole catchment to June. The chart below shows the contribution from each sewage treatment plant, pumping station and combined sewage overflow. The bars only show duration in hours and do not show volume .. so somewhere like Ironsbottom a small STW would be discharging a much lower volume of overflow than Crawley STW despite greater similar hours of spill duration.

Finally... we have not touched on the big diesel spill this month on the A24... we are however very much onto this incident and were all over it from the outset with our fantastic volunteers out monitoring water courses for any signs of pollution. We are in discussions with the EA and other agencies and part of the River Mole Catchment Partnership to ensure that full protection and clean up is afforded to the river.

Also finally we have been so busy media wise.. as usual.. from appearing on Belgian news TV, running stalls at Brockham Fete to this awesome article in the Sunday Times.
Thank you for reading this brief round up of our busy news. July test coming up soon!


Comments